Gold SELL ideaGold presently is at POS ( POIJT OF SELL) Find best entry to sell. TP around 2308and wait for next market movement
Good luck
Futures market

S&Pwhatever this is. S&P deez lines.
i'll chart anything. this is like my freecell or solitaire or sudoku candles up. candles down. x3 each chess. its like chess.
is there a minimum word count for these?
i'm gonna be ___ later if price doesn't at least touch one of these lines

Oil Broader Support Market Optimism, Despite Lingering UncertainOil prices edged higher this week, marking their strongest gain in seven days. This upward momentum came despite a somewhat ambiguous outlook for crude itself, suggesting the driving force behind the rise lies elsewhere: positive sentiment in the broader financial markets.
Risk-On Rally Lifts Oil
The primary factor behind oil's recent rise is the prevailing "risk-on" sentiment dominating global markets. Equity indices, particularly in the United States, have been scaling new highs, with the S&P 500 reaching its 30th record this year. This optimism seems to be spilling over into the commodities market, including oil. Investors, buoyed by the positive performance in equities, are displaying a greater willingness to take on risk, and oil is seen as a potential beneficiary.
OPEC+ Cuts and Geopolitical Tensions Offer Underlying Support
Beyond the broader market sentiment, a couple of oil-specific factors are also contributing to the price increase. Firstly, the decision by OPEC+, the world's leading oil producer alliance, to extend production cuts has helped to tighten supply and prop up prices. Anxieties surrounding potential disruptions due to geopolitical tensions in major oil-producing regions like the Middle East are also lending some support.
Mixed Outlook for Crude: Demand Questions Linger
However, the outlook for crude remains somewhat clouded by uncertainties. While the supply side appears relatively stable thanks to OPEC+ intervention, demand remains a question mark. Signs of slowing economic growth in some parts of the world, particularly in Asia, raise concerns about future oil consumption. Data from China, a major consumer of oil, recently indicated weaker-than-expected industrial activity, potentially signaling a softening demand outlook. Additionally, rising gasoline prices in some regions, like India, could dampen consumer spending and lead to lower demand for fuel.
The Balancing Act: Weighing Optimism Against Uncertainty
The current situation presents a complex picture for oil markets. The positive sentiment in broader financial markets is providing a tailwind for oil prices. However, this is counterbalanced by lingering uncertainties about future demand, particularly in Asia. The net effect of these opposing forces will determine the future trajectory of oil prices.
Looking Ahead: Navigating a Volatile Market
Oil will likely see continued volatility in oil markets. Investors will be closely monitoring key factors like:
• Global economic performance: The health of major economies, particularly China, will significantly influence oil demand.
• Monetary policy decisions: Actions by central banks, especially the U.S. Federal Reserve, could impact risk appetite and indirectly affect oil prices.
• Geopolitical developments: Events in major oil-producing regions can disrupt supply and cause price spikes.
By carefully weighing these factors, market participants can navigate the current uncertainty and make informed decisions regarding oil investments.

Conflicted Euro Caught Between Hawkish Fed and Political IssuesThe Eurozone's currency, the Euro, finds itself in a precarious position, buffeted by two powerful forces: the tightening grip of the U.S. Federal Reserve and the ever-present political turmoil within the European Union. Navigating this treacherous landscape presents a significant challenge for investors and traders alike.
The Fed Talks A Rising Tide Sinks All Boats
The primary driver of the Euro's woes is the aggressive monetary policy shift by the U.S. Federal Reserve. In response to surging inflation, the Fed has embarked on a series of interest rate hikes, making the U.S. dollar a more attractive proposition for investors. Higher interest rates in the U.S. entice investors to park their funds in dollar-denominated assets, leading to a stronger dollar. This, in turn, weakens the Euro through a simple principle: currency exchange rates operate on a relative basis. A stronger dollar makes the Euro comparatively less valuable.
The Fed's actions have a ripple effect across global financial markets. As the dollar strengthens, it attracts capital away from other currencies, including the Euro. This capital flight weakens the Euro's value and creates a vicious cycle. Additionally, a stronger dollar makes Eurozone exports more expensive on the global market, potentially dampening economic growth in the region.
European Internal Divisions Weigh Heavy
Adding to the Euro's woes are the ongoing political uncertainties within the European Union. The bloc faces several internal challenges, including:
• The Rise of Euroscepticism: Populist movements that question the benefits of European integration are gaining traction in some member states. This creates uncertainty about the future of the Eurozone and discourages investors from committing to the Euro.
• Disunity on Fiscal Policy: Member states often have differing government spending and taxation priorities. This can make it difficult for the European Central Bank (ECB), the Eurozone's central bank, to implement a cohesive monetary policy that benefits all members.
• The Ukraine War: The ongoing war in Ukraine has added a layer of economic and political instability to the region. The war's impact on energy prices and supply chains further dampens the Eurozone's economic prospects.
These internal divisions weaken the Euro's image as a stable and reliable currency. Investors are more likely to favor the dollar, which is seen as a safe haven during times of global uncertainty.
Steering Clear of the Dollar's Influence: Alternative Strategies
While the Euro's near-term outlook appears uncertain, traders looking to speculate on the currency should consider strategies that minimize the impact of the dollar's dominance. Here are some potential approaches:
• Focus on Eurozone Fundamentals: Analyze the economic health of individual Eurozone member states. Look for countries with strong economic fundamentals, such as low unemployment and healthy trade surpluses. Currencies of these countries may outperform the Euro itself.
• Play the Spread: Instead of directly trading the Euro against the dollar, consider trading it against other currencies within the Eurozone itself. This approach could benefit from internal economic disparities within the bloc.
• Focus on Long-Term Trends: The Eurozone, despite its challenges, remains a large and economically powerful region. Long-term investors may choose to hold the Euro based on their belief in the region's eventual economic recovery and political stability.
Conclusion: A Currency at a Crossroads
The Euro's current predicament highlights the complex interplay between global economic forces and regional political realities. While the dollar's strength and internal European divisions pose significant challenges, opportunities still exist for investors who can navigate these volatile conditions. By focusing on Eurozone fundamentals, exploring alternative trading strategies, and considering long-term trends, traders can potentially find success even as the Euro is in a conflicted battle.

silver tongue devilthis silver tongued devil is gonna do silver tongued devil stuff when you aren't looking. Hope those lines get tested and broke and kissed... alright i'll stop, your loss.

NQ E-mini FutureHi guys,
In this chart i Found a Demand Zone in NQ CHART for TRADING entry,
Observed these Levels based on price action and Demand & Supply.
*Don't Take any trades based on this Picture.
... because this chart is for educational purpose only not for Buy or Sell Recommendation..
Thank you

VX BreakoutI've posted a few ideas on VX, mostly focusing on a falling wedge from the top in April, but there's another wedge on a smaller time frame shown here. VX has broken above both the longer term and shorter term wedges. I would say this is a pretty large divergence, because ES and NQ are making new all time highs every day, but VX is showing strength.
VX has failed to show any strength since April, so it seems quite odd to me that it's gaining strength as we rally. Highly suspicious in my opinion, will be an important watch moving forward.

What Declining Copper Price is telling us?From recent high to current close, copper prices have declined nearly 14%.
Copper is one of the most used elements in various industries and its declining price indicates decreasing demand which in turn indicates the slowing economy.
Historically, slump in copper prices precedes stock market correction and with valuations being so high, it is wiser to book your profits and sit on a pile of cash and wait for a good dip when you will be able to buy the same stocks you are holding now at cheaper price. However, no one can guess when the actual meltdown is going to start. So keep an eagle eye on your chart.
As for as Indian market is concerned, it is expected to follow global cues as of now and you might see a moderate gain in indices today. However, when Zeta Stock Scanner starts showing you more red stocks than green on daily chart, it would be time to book your profits and make an early exit.
For today, Grasim, Trent, GMRInfra, BEL, Titan and of course Mazdock seem to be all set to gain some more points.
Happy Trading.

E/u and G/U top downs top down analysis using SMC made live for you so that eventually you can also understand how i operate on live markets
if you want to know how i enter trades or how i see a certain asset just follow me, message me and i will most likely do a custom video for you.
tell me if you would like a tutorial video of how i find structure or SnD zones

Daily Recap & Small Account Challenge Day 25A recap of today's action, another strong day for bulls. New all time highs for the S&P and Nasdaq, with semis like AVGO leading the way. VX remained fairly strong today in my opinion, still watching it closely to see if it can get back over 14.35 or if it's time for more decay.

Daily REcap ES price Action Review 6-17-24Going over the price action ES for the day. looking back to how we could have traded it better and what to focus on for the next session.

1:2 rrr xagusd long1:2 rrr xagusd long
1 day key support
4hr asymmetrical triangle break and a retest

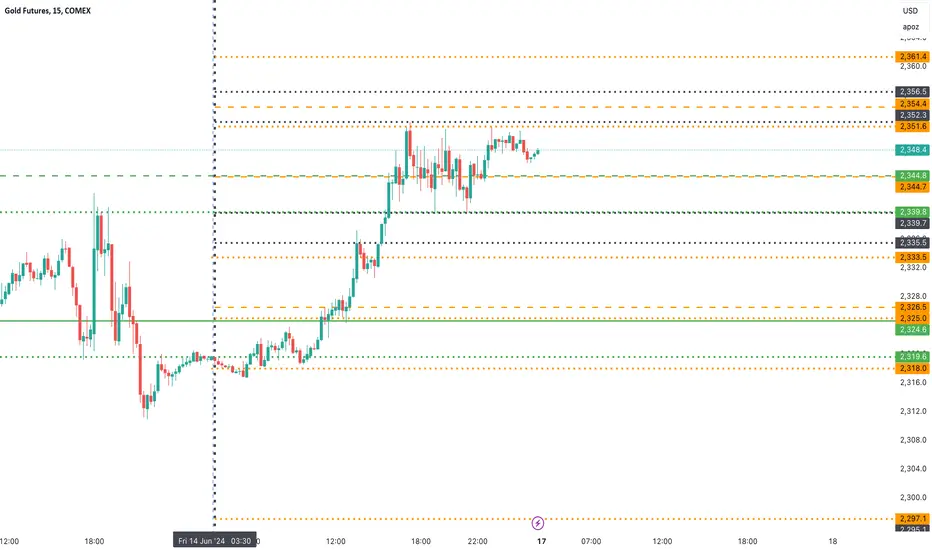
Gold COMEX Future - Intraday Levels - 17th June 2024if Sustain above 2351.6 or 2352.3 then 2354.4 then 2356.5 or 2361.4 above this bullish then 2372.6 then 2379.6 then 2396.9 to then 2412 to 2413.7 or 2417.1 to 2417.9 above this more bullish
if Sustain Below 2344.7 then 2339.7 to 2335.5 or 2333.5 below this bearish then 2326.5 to 2324.6 then 2319.6 to 2318 below this more bearish then 2297.1 to 2295.1 then 2290.9 to 2290.1
Consider some buffer points in above levels.
Please do your due diligence before trading or investment.
**Disclaimer -
I am not a registered analyst or advisor. I does not represent or endorse the accuracy or reliability of any information, conversation, or content. Stock trading is inherently risky and the users agree to assume complete and full responsibility for the outcomes of all trading decisions that they make, including but not limited to loss of capital. None of these communications should be construed as an offer to buy or sell securities, nor advice to do so. The users understands and acknowledges that there is a very high risk involved in trading securities. By using this information, the user agrees that use of this information is entirely at their own risk.
Thank you.
silver could fall 2-6% (correction phase)the bull run on silver looks almost over and the consolidation to corrective phase (ABC) is under way
we have the projection of price falling to the 86000 to 82000 zone which is almost (2-6%)
will update more information the price action progress

ANALYSIS EXPERT GOLD FIBONACCI AND MOMENTUM(GOLD/USD) with various technical indicators and levels marked on it. Here’s an analysis based on the chart provided:
Key Observations:
Price Levels:
Current Price: 2,314.14 USD
Major Support: Around 2,249.57 USD
Major Resistance: Around 2,859.87 USD
Fibonacci Levels:
1.0 Retracement: 2,395.68 USD
1.618 Extension: 2,859.87 USD
2.618 Extension: 3,033.54 USD
Trend Channels:
The price is moving within an ascending channel with dashed orange lines indicating the channel boundaries.
There are also upward projections indicating potential future price paths.
Projected Move:
Two projected upward moves (one steeper than the other) suggesting potential targets around 2,575.45 USD and 2,859.87 USD.
Additional Support and Resistance Levels:
Intermediate support around 2,217.75 USD.
Intermediate resistance around 2,575.45 USD.
Analysis:
Support and Resistance:
The current price is near the middle of the ascending channel, indicating room for movement in either direction within the channel.
Immediate support is found at 2,249.57 USD, which aligns with the lower boundary of the channel and a Fibonacci level.
Strong resistance is expected around 2,395.68 USD, which is the 1.0 Fibonacci retracement level.
Fibonacci Retracement and Extension:
The price needs to break above the 1.0 Fibonacci retracement level (2,395.68 USD) to confirm a bullish trend towards the 1.618 extension (2,859.87 USD).
Beyond that, the 2.618 extension (3,033.54 USD) indicates a potential longer-term target.
Trend Channels:
The ascending trend channel suggests a bullish bias as long as the price stays within the channel.
The channel boundaries provide potential support and resistance levels.
Projected Move:
The upward projections suggest that if the price maintains its upward momentum, targets around 2,575.45 USD and 2,859.87 USD are achievable.
These projections align with the Fibonacci extensions and trend channel analysis.
Strategy:
For Bulls:
Look for long entries near the lower boundary of the ascending channel around 2,249.57 USD with a tight stop loss below this level.
Target the 2,395.68 USD level initially, with a potential extension towards 2,575.45 USD and 2,859.87 USD.
Monitor price action around key resistance levels for potential profit-taking or further continuation.
For Bears:
Watch for a breakdown below 2,249.57 USD for potential short entries, targeting lower support levels.
Alternatively, consider short positions around the 2,395.68 USD resistance if the price shows signs of reversal.
Conclusion:
The chart indicates a potential bullish scenario if the current support levels hold, with targets towards 2,575.45 USD and 2,859.87 USD. Traders should watch key levels and trend channels for confirmation and manage risk accordingly. The ascending channel provides a clear framework for understanding potential price movements and identifying strategic entry and exit points.

Gold 70,100 possible !!we have seen on daily time frame price formed rising wedge pattern
on friday 7jun we seen a bearish big candle confirming the breakdown of the pattern
price then tried to take a bounce from recent orderblock
but we can clear see that the bearish pressure is not letting the bullish orderblock go any further up
causing the price to form a small triangle pattern which will eventually work as buildup for more down side and we can 70,100 level in coming days
will further after price hits 70,100 level
follow for more

YM OHLC STAT MAP + ADR!every day, every week and it won't stop . . .
Bullish = +M & -ADR | Target : opposing M / +ADR

FOMO and reactions in the marketThis is a typical example that triggers FOMO.
We set an Exit 1 and 2 and course gave us a waterfall on Exit 5 or more immediately.
if you are not careful Fear Of Missing Out will hunt you with those kind of examples.
When market shows you, you could have been greedier.. "could have" is dangerous. Because on an Exit 1 and Exit 2 results can be measured.
Don't let this hunt you <3

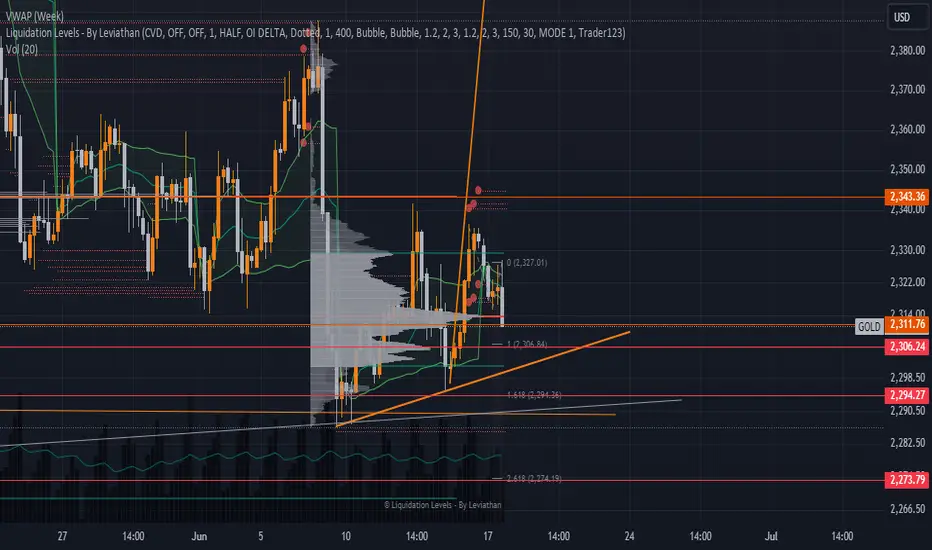
GOLD ANALYSISGold (GOLD/USD) with various technical indicators and levels marked on it. Here’s an analysis based on the chart provided:
Key Observations:
Price Levels:
Current Price: 2,311.76 USD
Major Support: Around 2,294.27 USD and 2,273.79 USD
Major Resistance: Around 2,343.36 USD
Fibonacci Levels:
1.0 Retracement: 2,306.84 USD
1.618 Extension: 2,294.36 USD
2.618 Extension: 2,274.19 USD
VWAP (Volume Weighted Average Price):
Weekly VWAP: 2,321.00 USD
Volume Profile:
Shows significant trading volume and price acceptance around the 2,294 USD to 2,306 USD range.
Trend Lines:
Upward sloping orange trend lines indicate a potential ascending support level.
Projected Move:
An orange projection indicates a potential sharp upward movement targeting the 2,343.36 USD level.
Analysis:
Support and Resistance:
The current price is slightly below the weekly VWAP, indicating potential resistance around the 2,321.00 USD level.
Immediate support is found at the 2,306.24 USD level, which aligns with the 1.0 Fibonacci retracement.
Strong support is expected around 2,294.27 USD, indicated by both the 1.618 Fibonacci extension and volume profile.
On the upside, significant resistance is expected around 2,343.36 USD, which is a key level marked on the chart.
Fibonacci Retracement and Extension:
The price needs to hold above the 1.0 Fibonacci retracement level (2,306.84 USD) to confirm a bullish trend.
Below this, the 1.618 extension (2,294.36 USD) and 2.618 extension (2,274.19 USD) provide deeper support levels.
VWAP Analysis:
Trading slightly below the weekly VWAP suggests some bearish pressure, but a move above this level could shift the bias to bullish.
Volume Profile:
The highest trading volume and price acceptance occur between 2,294 USD and 2,306 USD, indicating this range as a critical support zone.
Trend Lines:
The ascending trend lines suggest an upward momentum, with the price finding support on these lines in case of a pullback.
Projected Move:
The sharp upward projection suggests that if the price holds above the current support levels and gains momentum, a rapid move towards the 2,343.36 USD resistance is possible.
Strategy:
For Bulls:
Look for long entries around the current support at 2,306.24 USD with a tight stop loss below 2,294.27 USD.
Target the 2,321.00 USD level initially, with a potential extension towards 2,343.36 USD.
Monitor price action around key resistance levels for potential profit-taking or further continuation.
For Bears:
Watch for a breakdown below 2,294.27 USD for potential short entries, targeting lower support levels around 2,274.19 USD.
Alternatively, consider short positions around the 2,343.36 USD resistance if the price shows signs of reversal.
Conclusion:
The chart indicates a potential bullish scenario if the current support levels hold, with targets towards 2,343.36 USD. Traders should watch key levels and volume profile zones for confirmation and manage risk accordingly.
XAUUSD gold short UPDATEShort Update
Hello Hello there,
I'm still looking short on GOLD and added my entry on the NY opening. Because it didn't break my 1H high which was 2327.
I will look short until 2312 for this additional entry.
40 pips already went down and partially closed my 70% of my entry.
I wish you guys the best for this week.
Please trade on your own risk.
Good luck

Trend in Trend XAUUSDNew idea around 2327.6
If the following conditions are fulfilled this is a good sell for the follow up of the NY Session.
- Momentum
- RSI Reversal in 5min
Direction is given in H1
News was good on USD meaning, it should theoretically reverse soon.

XAUUSD: 4HR Ready to Ride the Golden WaveThe price is trading around $2,321.83, hovering just above the 21 EMA indicating a potential bullish move.
The price has bounced off the support level at $2,317.74 and is showing signs of heading upwards.
Key Levels:
Support: $2,317.74
Resistance: $2,335.13, $2,350.00
Entry Strategy:
Buy Setup: Look for a strong bullish candle closing above the current level ($2,321.83) and maintaining above the 21 EMA. Confirmation above the $2,322.06 level would be ideal for entry.
🎯TP: $2,335.13
Stop-Loss: Place your stop-loss just below the support level at $2,317.74. This keeps your risk tight while aiming for a solid 1:3 risk-to-reward ratio.

NQ - trading session no.254:00pm - 5:00pm
good session today
Im using the ATR to determine the size (ticks) for my SL
PnL: +2 RR
