Good for scalpingThink it might be good opportunity to go long in GOLD, but dont forget close ur order before market close
Good Luck and Trade wisely !!
Futures market

NQ - trading session no.244:00pm - 4:26pm
not enough volume in the market today, unfortunate
PnL: -2 RR
Weekly PnL: +4.5 RR

sell! is coming anytimeGold is stuck in the zone and its also at a breakup point If it closes a candle above then its likely the gold will increase or else you know

WTI in weekly chartHello
It seems that USOIL decided to make a time-consuming pattern like Triangle but you know that no one can predict internal sub-waves of a triangle so the best strategy is to wait.
There are 2 scenarios:
1. Oil is rising from here as wave 3 (Red) which does not make sense but possible.
2. Oil is making a Triangle the can be wave B of ABC of X or this triangle is our x wave (Scenario 2').
I follow scenario 2.
Time shows us.
Thanks

BANKNIFTYBANKNIFTY closed above va
1. gapup 50160 long till 50300
2. 50150-50000 trade breakout
3. gapdown 50000 short


$ES scalpWaiting for 5408-5406.50 to buy long for a scalp. Remember we don’t need the whole move. Just a consistent piece

Today's Gold Price Update: A Continued DowntrendGold prices today continue to face downward pressure, currently trading around $2314 , losing 0.45% for the day with a drop of over 100 pips during the early Asian trading session.
Despite a strong rally last night that pushed gold close to $2350, the precious metal couldn't maintain its recovery. This was despite the U.S. Dollar weakening after the U.S. released its economic data.
The USD took a hit after the U.S. Consumer Price Index (CPI) for May showed a faster cooling than economists had anticipated. The CPI remained flat after a 0.3% increase in April, while the forecast was only for a 0.1% rise.
Gold Price Forecast:
News Perspective: The Federal Reserve is expected to implement two rate cuts this year, with an 80% chance that the first cut will happen in September. This scenario typically leads to a weaker USD, which could benefit gold prices.
Psychological and Technical Perspective: From a technical standpoint, gold remains in a downward channel. In the short to medium term, the market sentiment still favors selling gold. The EMA and trendline indicators continue to support the bearish outlook for gold.
Key Points:
Current Price: $2314, down 0.45% for the day.
Support and Resistance: Unable to sustain gains around $2350.
Economic Data Impact: USD weakened after lower-than-expected CPI data.
Fed Rate Cuts: Expected to cut rates twice this year, with the first likely in September.
Technical Indicators: EMA and trendline favor continued bearish movement.
Stay tuned and watch for how these factors play out in the coming days. What’s your take on the current gold trend?


BTC/USD bowl. Breakthrough 64-72. Cyclicality. Nasdaq - BTC.Logarithm. Completion time 1 week. Instead of updating an old idea regarding the Nasdaq Index and BTS on pump cup formation published on 06/17/2023, I decided to implement the idea on a live chart.
Comparative analysis. Fractal. Lag. Bitcoin and Nasdaq
17 06 2023
I have applied the cup percentages as well as the cup with handle if formation occurs (high probability). Although the cycle high targets and timing are the same as what I showed in 2022 during the Bitcoin accumulation phase.
So, for clarity with the last cycle and its highs in 2021.
BTC/USD Secondary trend cycles and halvings . 1 07 2022
BTC/USD Halving 518 When will be the cycle price low and high.
02.09.2023
BTC/USD Main trend (3 years) Channels Triangle
09 2023
At the moment, the price is above the “demons of Solomon” zone, that is 72,000. Zone 64-72 – resistance of the large bowl (last cycle highs 64-69). Let's follow the fractal similarity of 2015-2017. There is a high probability that a rollback will occur slightly higher, and a long-term bullish formation will be formed (trend direction, large time frame) — “Bowl with handle”. Or straight to the psychological level of 100?).
Pay attention to interest rates and price levels in the past and now.
1️⃣ Let me remind you that in April the halving is closer to the 20th. Most likely this will happen on the day "18" . Do you think that bitCocaine will cost 84,018 closer to this time?) What will happen to this zone?
2️⃣ Psychological PR level - the zone for Bitcoin is $100,013.
3️⃣ Everything else probably looks unreal for most market participants, but what is shown now is real, just as it was a very long time ago.
Adhere to these simple rules:
1) Understand and exploit the cyclical nature of the market.
2) Buy low, sell high. And not vice versa like most).
3) Take profits in parts on the hype (now) in a growing trend or protect with a stop loss.
4) Have an understanding of the relationship between the liquidity (capitalization, roughly speaking) of a trading instrument and its volatility and potential.
5) If you trade locally. The crowd is shouting: “cryptocurrency is a scam” - buy it. “Crypto hype” - sell it.
6) Do not be interested in the news and the opinion of the majority, this is all “taken into account in the price movement schedule.”
7) Always have at least 20-30% of stablecoins in reserve. If, for example, in a developing trend there is a correction to quickly remove longs (futures, margin with large shoulders, in spot - stop loss) by a significant%, and some of your stops do not work due to price slippage, then a “cash airbag” will calm and warm you in such an unpleasant moment).

Xauusd after a series of important news from the FedYesterday's news announced to us
First, the ppi decrease combined with the unemployment benefits application index increased. Combined with a decrease in CPI, this is beneficial for Gold to increase because the economic situation seems to be weakening, putting pressure on the Fed to reduce interest rates. However, Nonfarm data, specifically the employment index, has increased sharply in the recent period, which is the motivation for the Fed to keep the current interest rate at 5.9%. This is the reason why PPI news, although beneficial for Gold, cannot last long.
Look at H1
- We are having the idea of an abc correction model. In which we expect wave c to complete
- In front of us we have 2 important price zones: 2307 and 2287, these are 2 price zones that help us determine the direction of the price.
- If the price breaks out at 2307, this is a necessary condition for the orange wave c to complete. Then we have 2 target price zones of wave c: 2350.4 and 2364.6. These are 2 areas where we can look for Sell orders
- If the price breaks out below 2287, this is a necessary condition for the price to fall to the target zone of wave 5, which is 2264. This is the area where we look for a Buy order.

OIL: First red day, three days cycleHi everyone and welcome to my channel, please don’t forget to support all my work subscribing and liking my post, and for any question leave me a comment, I will be more than happy to help you!
“Trade setups, not movements”
1. DAY OF THE WEEK (Failed Breakout, False Break, Range Expansion)
Monday DAY 1 Opening Range
Tuesday DAY 2 Initial Balance
Wednesday DAY 3 (reset DAY 1) Mid Point Week
Thursday DAY 2
Friday DAY 3 Closing Range ✅ day 3 cycle
2. SIGNAL DAY
First Red Day ✅
First Green Day
3 Days Long Breakout
3 Days Short Breakout
Inside Day
3. WEEKLY TEMPLATE
Pump&Dump ✅
Dump&Pump
Frontside
Backside ✅
4. THESIS:
Long: secondary, the market could go to retest the HOW for further move during the upcoming week, not really interested in this scenario, unless a clear dump and pump made in 3 sessions.
Short: primary, first red day, failed breakout of the HOW, potential backside move back into the LOW. However, the market is In Balance, no other time frames triggered yet. Before shorting this market I will be waiting for one of the two yesterday extremes to be triggered, looking then for a sell high opportunity.
Please note that the purpose of my analysis is to help me and you hunting the best trade setup for the day, none of my technical aspects are a way to forecast any directional market movement.
Gianni

nasdaq look downsatoday in the market. in NQ futures we have a range above a a gap.
we seem to be trading below the mid point of the lower part of the range.
so we are looking for a short.
first entry in 19,842 with stop in red and target in green 19,760 first target and 2 target closing the gap at 19,612.
we seem to be having more selling preasure in the range we are at the moment.
embrace the loss to unlock the green days.

GOLD Near a Breaking PointGOLD Near a Breaking Point
The current situation in relation to interest rates is keeping gold under pressure. The FED's decision not to change the interest rate was a clear message that the FED want to see the dollar as the leader in the currency board.
GOLD reached a decline to 2295, but again failed to break the barrier close to 2275, which many were expecting.
Regardless of the speculations, GOLD found the strength to grow again. Apparently GOLD has more to do with bullish speculators increasing its value than with the decision of interest rates.
If GOLD will break above 2341 then it will continue to grow towards the top again.
On the contrary, we can see gold retesting the area near 2295
You may find more details in the chart!
Thank you and Good Luck!
❤️PS: Please support with a like or comment if you find this analysis useful for your trading day❤️

Sell idea - GOLD XAUUSDSelling again here, the last shorts got stopped out.
XauUsd Gold sell idea!
Heed your DD!
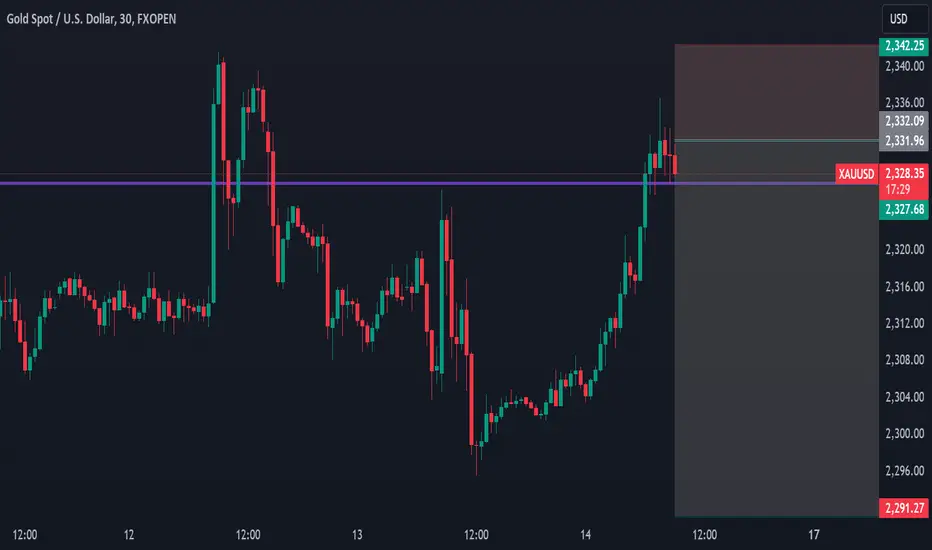
XAUUSD 30 Confirmation: Ensuring the price sustains above 2314.00 before entering the position can help confirm the trend and avoid false breakouts.
Target Level: In this strategy, the take profit is set at 2341.00, meaning the position will be closed once the price hits this level, securing the gains.
Stop-Loss Order: It’s advisable to set a stop-loss order below the entry point to limit potential losses if the trade goes against expectations.
Position Sizing: Carefully determine the size of the position based on risk tolerance and the overall trading strategy.
By following this strategy, traders aim to capitalize on a price movement between 2314.00 and 2341.00, effectively managing risk and securing profits through predetermined entry and exit points. 🤞🤞🤞

GOLD SHORTi think the gold still need to go more up but as i see maybe its just going down for correction
targting area 2256/2266
but if it breaks up the descending channel up then correction will fail and it will continue up

Gold can go down anytimewith a short sl You can sell
Trade own your own risk
goold is in a downward moment and currently at the top of that moment


Gold Rebounds with Potential for Further GainsGold has found short-term support near 2300 and has rebounded, currently trading around 2330. Major indicators suggest that the bullish momentum has not been fully exhausted. There is a high likelihood of another upward movement in the US market today or early next week, with strong resistance expected around 2352. At that point, the bullish momentum may wane, entering a consolidation phase. If the indicators fail to signal a renewed bullish trend, gold prices could drop below 2300, with the next short-term target around 2268.

US WHEAT, still a bit to the downsideUS Wheat futures.
2022 Ukraine-Russia War spiked prices to the 13.000$. Since that moment, prices have retraced to the 550$ levels. Notice the useful trend lines, key pivots for reversals.
Also, AVWAP (in purple) since the 2022 highs has been a key line to watch for lately, as short sellers will try to push the prices to the downside when reached.
Elliott countdown also suggests further downside to finish the 5th wave
My PT remains in the 500$ area

CRUDEOIL 30 MINLETS SEE WHAT HAPPENS...!!
I Am Not SEBI Registered Analyst. All Post and Levels Posting is only for educational and knowledge purpose. I Am not responsible for your any kind of loss or profit.
No Claim, All Rights Reserved.‼️

STEEL, breaking above the downtrend, testing the key fibosSteel futures. A great world economy proxy
Bouncing and testing all key fibonacci levels. Still, no higher highs, hence trend remains bearish (so as for the economy?)
