DXY - Weekly Forecast - 03 June 2024We can go both ways, so i've pasted by view, there is also a video that walks through it.
My longer term view over the next few months is bullish on DXY
Market indices

DX - Weekly Forecast - 02 June 2024Weekly forecast of DXY for 02 June 2024, i think we can go either way and that represents opportunities on both sides with tight stops.

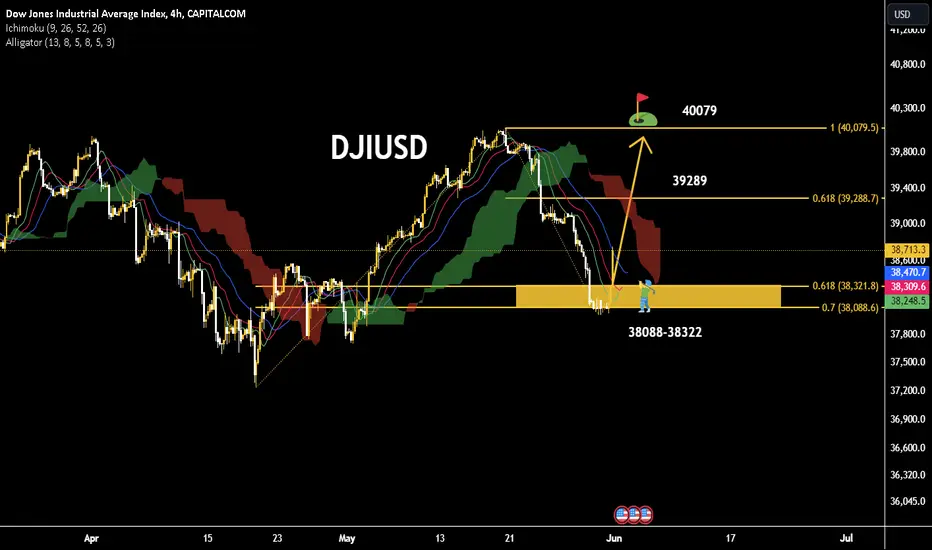
NEW IDEA FOR DOWJONES The increase in the Dow Jones index due to the increase in profits from the income of companies
By examining the trend in the four-hour time frame, the Dow Jones index, having an important support interval in the range of 38,322-38,088, can increase to the previous ceiling resistance in the range of 40,079, in the meantime, the 61.8% Fibo resistance will be seen at 39,289.
SPX GANN ANALYSISNow reverse for correction for target at 5284.25 then 5295.75
then supposed for reverse
staying above 5295.75 means reverse of downwards move

S&P 500 Daily Chart Analysis For Week of May 31, 2024Technical Analysis and Outlook:
In the shortened trading week, the S&P 500 hit our expected resistance level of 5323 and promptly fell as part of the renewed upward movement toward the support level of 5257 and the nearby support level of 5221. A solid upward bounce is on its way to target our newly identified key resistance level of 5323 for the upcoming trading week.

Weekly Analysis of UK100 Butterfly 🦋 the detail is shown in the above Idea.
I made this Idea based on Candlestick Analysis and Harmonic pattern using Fibonacci tools.
In the context of financial markets, the phrase " pull back to last golden level and flying UK100 butterfly to next golden level at 8320 " suggests a potential upward movement in the UK100 index, possibly after a period of consolidation or retracement.
Traders and investors may interpret this as a signal to anticipate a bullish momentum, aiming for a target level around 8320.
It highlights the importance of identifying key support and resistance levels, and the potential for significant price movements.
As with any market analysis, it's crucial to consider risk management strategies before making trading decisions at black circular region .


Powerful compressionIndex is compressing inside symmetrical triangle and going to explode soon
In hourly chart index is moving between 1H SMA50 and 1H SMA200 for some time
I suppose it will break down because of last bearish engulfing candle on weekly chart


NASDAQ: Perfect pullback execution. Bullish reversal next week.Nasdaq delivered the expected pullback which was validated when it crossed under the 4H MA50. Today it almost reached the 1D MA50, which is also where the 4H MA200 sits, turned momentarily bearish on the 1D technical outlook (now neutral/ RSI = 47.140, MACD = 151.030, ADX = 59.182) and the 1D RSI achieved symmetry with the December 6th 2023 Low. We still expect the 1.5 Fibonacci extension to get reached before the next pullback (TP = 19,250).
See how our prior idea has worked out:
## If you like our free content follow our profile to get more daily ideas. ##
## Comments and likes are greatly appreciated. ##

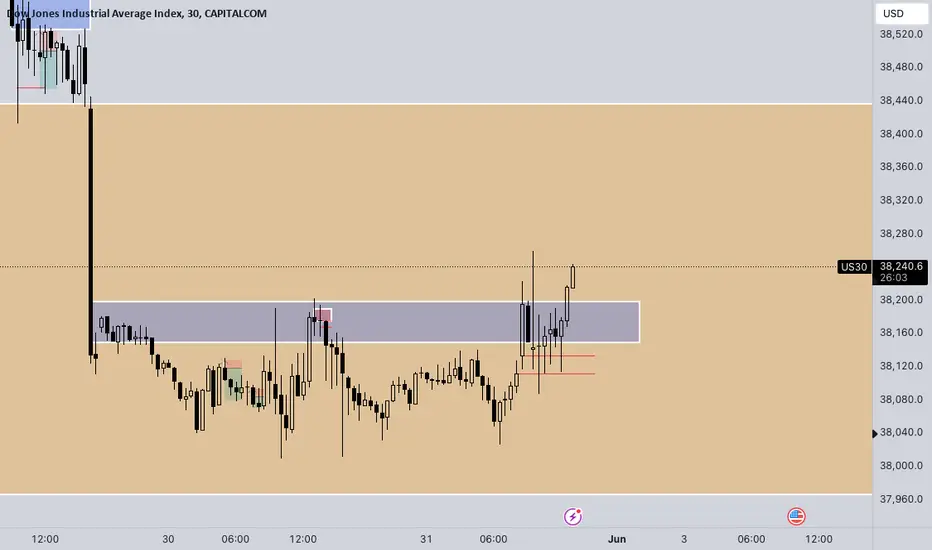
US 30 - Ranges overview (update) And just like that we end the month and take out the HTF buyside liquidity.
Just another end of the month...the weekend and a new week starting for a new month is awaiting us.
I hope you guys had a nice month and that your trading went alright.
As always whatever your bottom line for the month...it is simply a reflection of this month. Next month will be another month of new opportunities and trades. Don't forget RISK MANAGEMENT is your best friend..regardless of your profits.
Been a good month and some nice trending trading so let's see how we close the month...and what the market has in store for us traders next month.
Stay safe and never risk more than 1-5% of your capital per trade. The following analysis is merely a price action based analysis and does not constitute financial advice in any form.
Short Weekly Based on technical and price action analysis, the US 30 is expected to be short on a weekly timeframe, potentially dropping to 32,500.

Pre- Market analysis for first week of June 2024Either as soon as Sunday reopens
or perhaps London KZ /NY KZ,
I'm expecting for price to come tap
the low from Friday -last day of May.
OFC wait for a 1-5min BOS upward
for confluence on entry technique.
Expecting it to eventually take May's
high but will just target this upper
area. I think 500 pips will do me just
fine.

NASDAQ Analysis - Selling OpportunityNASDAQ Analysis - Selling Opportunity
Open: 18,883
SL: 19,0000
TP: 18,480

DOW JONES (US30) LONGS NOT BAD IDEADuring the uncertainty and risk off environment, low GDP data didn't come unnoticed and big boys accumulated some equities after the huge Salesforce panic.
Today, with NASDAQ loosing almost 2% and 0.7% for SP500, DJ was accumulated, so I think we might see nice and strong reversal for the end of the week and month close.
Play safe and good luck!

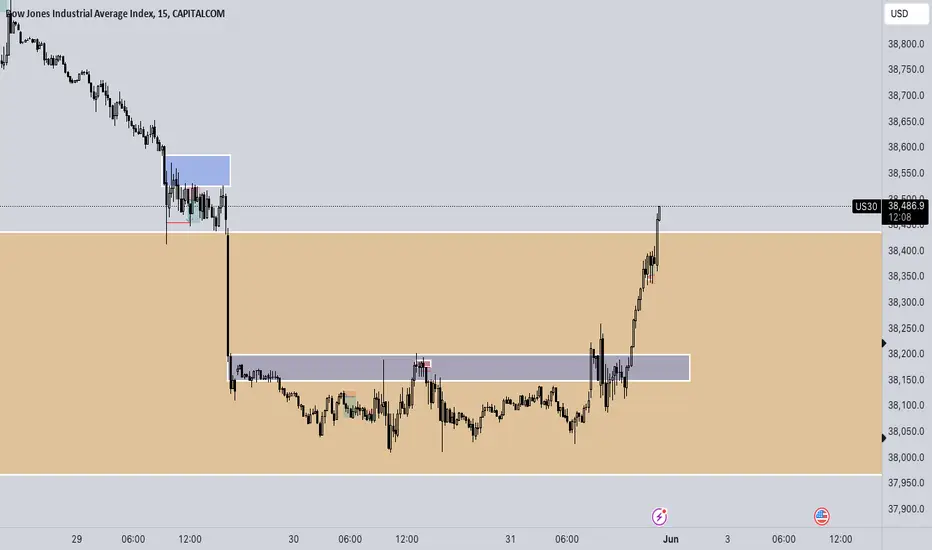
US 30 - Ranges overview (update) The 30min imbalance held and we've taken the buyside liquidity.
Let's see how we move further from here.
As always don't chase the market..let it come to you and ACT UPON IT
Stay safe and never risk more than 1-5% of your capital per trade. The following analysis is merely a price action based analysis and does not constitute financial advice in any form.
US Nas 100 _ Most _ Secure _ Trading _ Strategy _ Under _ TradinUS Nas 100 _ Most _ Secure _ Trading _ Strategy _ Under _ Trading _ Venue _ OANDA
Retest must hold within the key level of : $17,947 , $17,794.4, if support is not confirmed then we will be going as low as $17,354
B = Buy
S = Sell
If you're a professional trader then you'r first level of entry is at $17,824, otherwise, your safe secure level of confirmation is $18,090.2. Then simply follow each retest until market arrive at the advance Stage.
B : $17,824
S: $18,253.7
First trade executed
__________________
B: $17,947
S : $18,396.9
Second Trade Executed
_____________________
B: $18,090.2
S: $18,928.6
Third trade executed
_____________________
B : $18,253.7
S: $19,153.5
Forth Trade Executed
____________________
B: $18,621.8
S: $19,77.2
Fifth Trade Executed
_____________________

JPY index short viewSince the beginning of the year, the Japanese index in a bearish trend. The main resistance and trend indicators are the EMA 50-daily (white line) and the EMA 20-daily (purple line). The interest rate hike by the Bank of Japan did not bear fruit in strengthening the Japanese yen. The picture is still very bearish and we can expect a further pullback to the April low at 704.0.

Combo?Flat + X + Zigzag
A downward impulse could be underway to complete a flat pattern, which would be only the first part of a Flat+ZZ combination, so then a zigzag to the upside making a new ATH, so that then a sharp, violent zigzag completes the sideways pattern by August.
Or not!...

Bank Nifty important levels and trade plan for Monday, 3rd JuneBank Nifty important levels and trade plan for Monday, 3rd June
Resistance levels 49182, 49453, 49703
Support level 48967, 48721, 48486, 48315
Current trend- In daily time frame Continuation of an uptrend

US30 BULLISH CONFIRMATION!!The bullish strength formerly develop is currently active as price trades at $38,153 level. A buy opportunity is envisaged from the current market price .
Target is 38,491

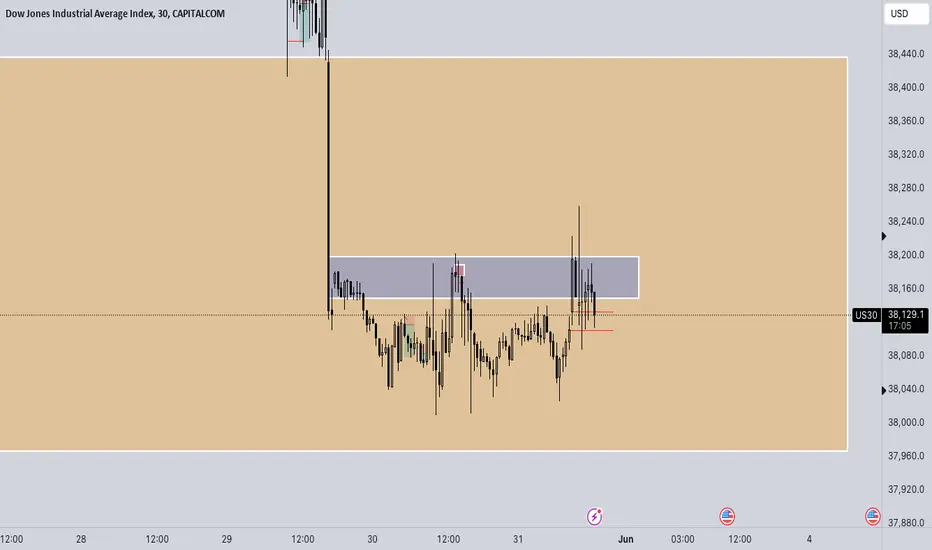
US 30 - Ranges overview Here is a quick look at the current range on US 30
We are currently trading back within the 30min imbalance. We've taken out the buyside and still respecting the HTF FVG (blue box)
IF we fail to close below the current lows expect us to hunt the buyside and continue going higher
IF we fail to hold these current levels we should expect some further downside towards the sellside liquidity.
It's Friday so keep your RISK MANAGEMENT in check and don't fumble your CAPITAL
Stay safe and never risk more than 1-5% of your capital per trade. The following analysis is merely a price action based analysis and does not constitute financial advice in any form.