Market indices


DXY next update.....
AronnoFX will not accept any liability for loss or damage as a result of
reliance on the information contained within this channel including
data, quotes, charts and buy/sell signals.
If you like this idea, do not forget to support with a like and follow.
Traders, if you like this idea or have your own opinion ab

A short term analysisUs 1 year bond is showing a strength which means dollar will or might do the same thing, expenditure of dollar will go to stock etc, on the other hand, the stock VALUE will be allocated to paper money DOLLAR
Not a financial adviice

A short term analysisUs 1 year bond is showing a strength which means dollar will or might do the same thing, expenditure of dollar will go to stock etc, on the other hand, the stock VALUE will be allocated to paper money DOLLAR
Not a financial adviice

GME Short Sale Volume Analysis: Short Selling Dynamics & Keltner
Overview:
GME is exhibiting compelling signals that warrant attention from traders and investors. We have observed significant activity in short sale volume alongside a notable expansion in the Keltner Channel. These indicators suggest potential market volatility and trend shifts in the near term.
Key Technical Indicators:
Short Sale Volume & Market Dynamics:
Short Selling Explained: Short selling involves borrowing shares of a stock and selling them on the open market with the intention of buying them back later at a lower price. Traders profit from the difference if the stock price declines. This practice is often utilized by investors who believe a stock's price will fall.
Role of Market Makers: Market makers facilitate the trading of stocks by providing liquidity. They are essential in ensuring that there are enough shares available for buying and selling, including those needed for short selling. Market makers often hedge their positions to manage risk.
Short Squeeze Potential: When the short sale volume is high, and the stock price begins to rise, short sellers may rush to buy back shares to cover their positions, fearing further losses. This buying frenzy can drive the stock price even higher, creating a short squeeze.
Keltner Channel Expansion:
The Keltner Channel, which utilizes the Average True Range (ATR) to set its boundaries, is currently expanding at the fastest rate since December 2020.
An expanding Keltner Channel indicates increasing volatility. The last time we observed such rapid expansion, it was followed by significant price action in GME, making this an essential indicator for traders.
Implications:
Bullish Sentiment: The high short sale volume suggests significant bearish bets, which could lead to a short squeeze if the price starts to rise, forcing short sellers to cover their positions.
Increased Volatility: The expanding Keltner Channel signals that GME could experience substantial price swings. This heightened volatility necessitates careful risk management, with wider stop losses to avoid premature exits during volatile price movements.
Hi! this was generated by AI because it's 02:16
version 2.0 if this picks up
cheers

DXY Will Go Down! Sell!
Please, check our technical outlook for DXY.
Time Frame: 1D
Current Trend: Bearish
Sentiment: Overbought (based on 7-period RSI)
Forecast: Bearish
The market is trading around a solid horizontal structure 104.533.
The above observations make me that the market will inevitably achieve 102.945 level.
P.S
We determine oversold/overbought condition with RSI indicator.
When it drops below 30 - the market is considered to be oversold.
When it bounces above 70 - the market is considered to be overbought.
Like and subscribe and comment my ideas if you enjoy them!

Seeking Assistance: Analyzing GME Short Sale Volume with Keltner
Hi TradingView Community,
I'm reaching out to this knowledgeable and vibrant community for assistance in analyzing the short sale volume of GameStop (GME) on a monthly basis. My goal is to gain deeper insights and potentially identify trading opportunities based on this data.
Current Analysis Setup:
Indicators in Use:
Keltner Channels: I’ve been using Keltner Channels to gauge the volatility and potential breakout points for GME. The channels are set with a 20-period EMA and a 2x ATR multiplier.
EMA Crossovers: Additionally, I'm observing the crossover of two EMAs (Exponential Moving Averages) - specifically, the 50-period and 200-period EMAs. These crossovers often signal potential trend changes and are crucial for timing entries and exits.
Areas I Need Help With:
Short Sale Volume Analysis:
I'm looking to understand the impact of monthly short sale volume on GME’s price movements.
How does an increase or decrease in short sale volume typically affect the stock's performance?
Are there specific patterns or trends in the short sale data that correlate with significant price movements?
Combining Indicators:
How can I effectively combine the insights from Keltner Channels with the EMA crossovers to improve the accuracy of my trade signals?
For those who have experience with these indicators, what are the best practices for interpreting signals from Keltner Channels in the context of short sale volume?
Identifying Key Levels:
What key levels should I be watching based on the interaction between the short sale volume, Keltner Channels, and EMA crossovers?
Are there historical precedents or case studies where these indicators have successfully predicted major price movements in GME or similar stocks?
Example Chart:
Below is an example chart illustrating my current setup, with the Keltner Channels and EMA crossovers:
Call to Action:
I greatly appreciate any insights, analyses, or resources that the community can share. Whether it's past experiences, detailed explanations, or even annotated charts, all contributions are welcome!
Thank you in advance for your support and expertise.
Yours truly
StrangleManiac

What’s Next for the S&P 500?The S&P 500 tried to break out yesterday, but got rejected at the highs. Some traders might view the resulting bearish outside day as a potential reversal pattern. How much damage was actually done?
The first pattern on today’s chart is the March 28 peak of 5265. Notice how SPX made a new high by crossing this level on May 15. Yesterday’s pullback tested it and prices have bounced today. That may suggest old resistance is becoming new support.
Second, this chart includes our MA speed custom study. It shows the rate of change for the 10-day simple moving average. Notice how the oscillator jumped as the index recovered in early May. This sharp acceleration resembled the move in early November as the current bull run began.
Third is the relatively tight consolidation following the surge. That’s similar to other moments in late 2023. It may reflect a lack of selling pressure.
TradeStation has, for decades, advanced the trading industry, providing access to stocks, options and futures. See our Overview for more.
Past performance, whether actual or indicated by historical tests of strategies, is no guarantee of future performance or success. There is a possibility that you may sustain a loss equal to or greater than your entire investment regardless of which asset class you trade (equities, options or futures); therefore, you should not invest or risk money that you cannot afford to lose. Online trading is not suitable for all investors. View the document titled Characteristics and Risks of Standardized Options at www.TradeStation.com . Before trading any asset class, customers must read the relevant risk disclosure statements on www.TradeStation.com . System access and trade placement and execution may be delayed or fail due to market volatility and volume, quote delays, system and software errors, Internet traffic, outages and other factors.
Securities and futures trading is offered to self-directed customers by TradeStation Securities, Inc., a broker-dealer registered with the Securities and Exchange Commission and a futures commission merchant licensed with the Commodity Futures Trading Commission). TradeStation Securities is a member of the Financial Industry Regulatory Authority, the National Futures Association, and a number of exchanges.
TradeStation Securities, Inc. and TradeStation Technologies, Inc. are each wholly owned subsidiaries of TradeStation Group, Inc., both operating, and providing products and services, under the TradeStation brand and trademark. When applying for, or purchasing, accounts, subscriptions, products and services, it is important that you know which company you will be dealing with. Visit www.TradeStation.com for further important information explaining what this means.

DOW $16,000 - $DJI Dow Jones Industrial down to $16,000 by 2031Based on my Great Depression Research I think we get a market top +5% - +15% above May 2024. And crash to mean-reversion based on old 1993 - 2018 trading channels which parks us at a 200 weekly bottom of $16,000 on DJI.
I am short the market until we prove otherwise.
You could replace NASDAQ:NVDA and "Magnificent 7" with NEWCONNECT:RCA and US STEEL from 1929 and the news papers would read exactly the same. They still thought the economy was strong all the way until middle of 1930.
There's no way to tell when we are in a great depression bubble that is imploding. The only way to tell is to short the market and if you make money - then we got problems.
All my shorts from earlier in May are now max-profit. So I'm adding to shorts.
Also all you people who think you're going to be rich; no you're not. You don't know what you're doing. The fact there's so many of you "I'm going to be rich" suckers is why I am bearish. Enjoy your Dow $16,000 suckers.


SHORTThis analysis is based on price and time expansion.
We have three time points defining an alternate time relationship for (top-to-top) or (top to bottom)
This time expansion alternating between tops and bottoms also puts the next point on 26th August 2024 weekly candle.
We also have a time projection on 10th June 2024 weekly candle(+/-1) where we expect markets to top.
That gives us a timezone between 10th June to 26th August 2024 to expect a heavy market reaction.
The two indicated times 965 and 685 days have a Phi relation of 3 : 2
341.2 x 1.4142 x 1.4142 = (341.2 x 2) = 682.39 units
341.2 x 1.4142 x 1.4142 x 1.4142 = (341.2 x 2(Root 2)) = 965.03 units
To narrow the time zone down we will need to align that with price expansion.
The current cycle unfolding is the ending part of the 20-year cycle with its origin at the 07/10/2002 bottom. Considering the March 2009 bottom as the actual low of this cycle we would expect a 4669.47 points advance from 666.79 to complete a Phi³ price expansion, where Phi = 5/3 = 1.667 and unit value = 1008 units.
That is:
666.79 + (1008 x 1.667³) = 5336.26
Current top = 5341.88 = 5336.28 + (5.6 pts)
The progression of the Phi Expansion from 666.79 price level:
666.79 + (1008 x 3/2) = 2178.79
666.79 + (1008 x 1.667) = 2347.13
Second Phi Expansion
666.79 + (1008 x 1.667²) = 3467.91
Third Phi Expansion
666.79 + (1008 x 1.667³) = 5336.26
The progression of tops and bottoms furnish us with two projections
1. Since the Phi points are all bottoms, price can advance about 1540 points off 5336.26 and the correction that will follow will rather end at 5336.26. That will put the top at (5336.26 + 1540) = 6876.26 price level. This top has no relation to the two projected dates on the chat.
2. Cycle expansions usually terminate at cubic Phi progression, that is (Unity x Phi³). So the third expansion will actually be a mid-cycle top which will effect a minor correction.The base of this correction will be the bottom for an advance towards 6876.26 level
From the above, any short entries should have tight stop levels
Please check back as we break the analysis further down to the daily and hourly sub cycles.
Trade safe, goodluck


NiftyToday on daily time frame new life time high with inverted candles.
Important support 22900 to 22750 and resistance 23250.
We may test 23250 in next week.

my opinion about nasdaq or us100My opinion there’s big bearish for next week so if the price go to that zone you can sell it

US 30 short - scalp trade Taken a nice small short scalp on US 30 to finish the week.
Entry 39137
TP 39114
SL 39157
Entered on the break of the lows on the 1min targeting the imbalance.
As long as we do not break and close above 39195 expect lower pa targeting the HTF sellside sitting around 39030
IF we break above 39195 we will continue higher toward yesterday's buyside liquidity
Noted the 15min breaker (blue box) which should be your main point of reference before trying to find entries on the LTF
Hope you guys have a great week and made the best out of every single day. Hoping you gained some better insight into your trading and that you've learned more about your system and yourself throughout this week. As always... regardless of your bottom line for the week (ending green or red)... this is just one week in the many more to come in your trading journey...don't fall for the illusion of achievement or failure...we LEARN AND GROW EVERY SINGLE DAY
Stay safe and never risk more than 1-5% of your capital per trade. The following analysis is merely a price action based analysis and does not constitute financial advice in any form.

NIFTY DAILY - 24/5/2024Nifty opens lower and made day low which is 22908 level, afterwards bulls drag the market upside and made All Time High that is 23026 level.
Nifty was highly volatile throughout the trading session, Nifty traded in between +50 points to -50 points for whole day.
Index has formed green body candle with long upper shadow which indicates seller were selling from days high.
Candle is trading at upper band of Bollinger Band.
Nifty is able to hold 22900 so, further resistance can be 23059 level with support of 22716 level.
Bank Nifty levels
Support – 48677
Resistance – 49334
Today’s Advance Decline ratio of NIFTY50
Advance - 17
Decline - 32 Unchanged – 1
FII Sell – 944.83 crores
DII Buy + 2320.32 crores.
⚠️ Important: Always maintain your Risk & Reward Ratio.
✅Like and follow to never miss a new idea!✅
Disclaimer: I am not SEBI Registered Advisor. My posts are purely for training and educational purposes.
Eat🍜 Sleep😴 TradingView📈 Repeat 🔁
Happy learning with trading. Cheers!🥂

NIFTY: Trading Plan for 24-May-2024
After the impressive movement we saw on Thursday, 23 May 2024, where prices hit our targets precisely, we might expect a more relaxed trading session on Friday, 24-May-2024. However, we should be ready for various scenarios. Here’s our plan:
Gap Up Opening
Above 23000: If prices open above 23000, they might face resistance near 23059 and trade sideways.
Above 23060: Prices can rise towards 23142.
Below 23000: Prices might find support at 22917-22897.
Below 22880: Look for support at 22803-22800.
Flat Opening
Support at 22915-22897: If prices open flat, they might first take support here.
Upside: After finding support, prices can move towards 23000-23059.
Below 22880: If this support fails, prices could drop towards 22800.
Gap Down Opening
Below 22880: If prices open below this level and stay there for the first hour, expect a drop towards 22800.
Recovery above 22915: If prices quickly recover above 22915, look for a move towards 23000-23059.
Conclusion: While a sideways session is likely, be prepared for quick movements in either direction based on these key levels.
Disclaimer: Trading involves risk, and past performance is not indicative of future results. Make trading decisions based on your own analysis and risk tolerance.

BANKNIFTY: Trading Plan for 24-May-2024After the excitement in BANKNIFTY on Thursday, we expect a quieter session on Friday, 24-May-2024. Here’s how to navigate different opening scenarios:
Gap Up Opening
Above 48850: If prices open above this level and sustain for the first hour, they can move up to 49000-49080.
Below 48760: If prices can't sustain above 48850 and drop below 48760, expect sideways trading between 48760-48602.
Below 48550: A drop below this level can push prices towards 48417, which should act as support.
Flat Opening
Near 48700: If prices open flat around this level, expect sideways movement between 48760-48600.
Above 48860: Sustained trading above this level can lead to 49000-49080, and potentially towards 49316.
Below 48600: Sustained trading below this level can cause a retracement to 48417-48400.
Gap Down Opening
Below 48600: If prices open below this level and stay there for the first hour, expect a drop towards 48400 and possibly 48260.
Recovery above 48600: Quick recovery above 48600 might lead to sideways trading between 48600-48760.
Above 48760: Prices could then aim for 49000-49080.
Conclusion: Although a quieter session is anticipated, stay alert for movements based on these key levels.
Disclaimer: Trading involves risk, and past performance is not indicative of future results. Make trading decisions based on your own analysis and risk tolerance.

STOP asking this dangerous two word questionWhat if?
This simple two word question is a psychological trap that traders often encounter.
And it does nothing more than undermine their decision-making process and overall trading performance.
This question will open a box of doubts, hypotheticals, and second-guessing.
This can paralyze action, distort risk assessment, and divert focus from the present to an endless maze of unrealized possibilities.
Let’s look into the psychological effects and what you can do to stop it from creeping in.
Psychological Impact
#1: Doubt and Hesitation
Constantly questioning “What if?” introduces doubt into the decision-making process.
For traders, you need to make decisions quickly and with confidence.
If you have any hesitation when you take a trade, it can lead to missed opportunities or entering positions at less than optimal prices.
#2: Fear of Missing Out (FOMO)
“What if this stock skyrockets after I sell?”
“What if this stock isn’t ideal?”
What if this trade hits my stop loss?”
This type of questioning can lead to either:
~ Holding positions too long.
~ Not holding positions long enough.
~ Not taking the trade.
~ Or missing great opportunities that come your way.
#3: Overtrading
Conversely, the fear of missing out can also lead to overtrading.
“What if this is the next big opportunity?”
Regardless on whether the trade lined up or not.
You might be compelled to jump into trades without proper analysis or strategy.
This will increase your trades, costs and your exposure to risk.
#4: Regret and Rumination
Traders who focus on “What if?” scenarios may dwell on past decisions, and this could lead to regret and rumination.
This backward-looking perspective can hinder the ability to learn from mistakes and make more informed decisions in the future.
So let’s try prevent the WHAT IF? Scenario.
Don’t you think?
Managing “What If?” in Trading
#1: Develop a Trading Plan
Make sure you have a clear, well-thought-out trading plan.
This will help you to minimise second-guessing.
If you have pre-defined entry, exit, and risk management rules in advance, you’ll be able to reduce the temptation to ask “What if?” and instead focus on executing your strategy.
#2: Embrace Risk Management
When you understand and accept the inherent risks of trading can alleviate the stress of “What if?” questions.
Effective risk management will help ensure you to prepare for all types of outcomes.
And you’ll handle your losses without deviating from your strategy.
#3: Stay Present
You need to be in the NOW moment.
This way you’ll be able to avoid the trap of hypotheticals.
Ask the questions:
Has my trading system aligned?
What is my daily and weekly bias?
#4: Accept Uncertainty
Recognise that market conditions are inherently unpredictable as I’ve mentioned many times.
The only thing you should have your mind set to are the probabilities and possibilities of trades lining up.
No outcomes can be foreseen or controlled.
All you can do is follow your strategy accordingly and forget about the prompt “WHAT IF?”.
Final words:
I think I have covered all the ways you need to stop worrying about the unknown.
You need to stop asking “WHAT IF?”. And start saying “NOW DO”.
Let’s sum up why we would ask the hypothetical question when we trade:
#1: Doubt and Hesitation
#2: Fear of Missing Out (FOMO)
#3: Overtrading
#4: Regret and Rumination
Managing “What If?” in Trading
#1: Develop a Trading Plan
#2: Embrace Risk Management
#3: Stay Present
#4: Accept Uncertainty

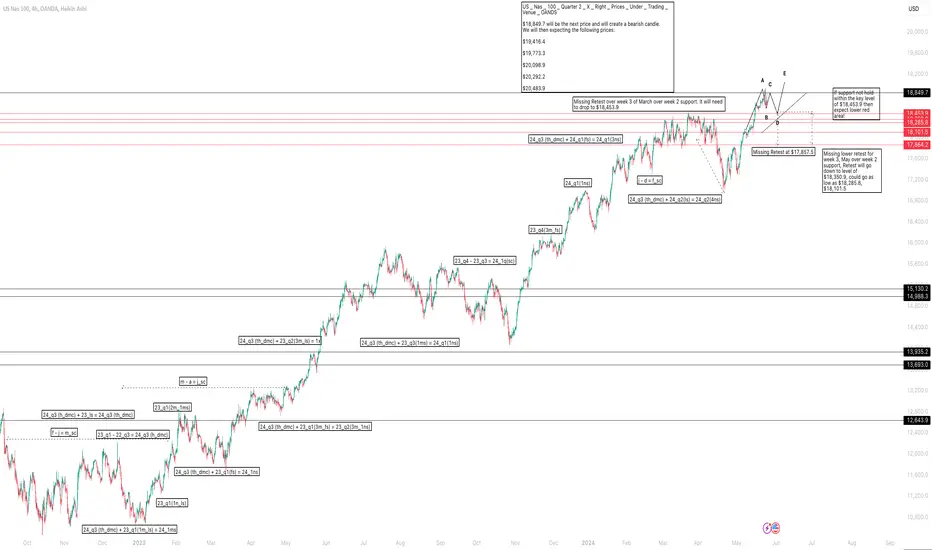
US _ Nas _ 100 _ Quarter 2 _ X _ Right _ Prices _ Under _ TradinUS _ Nas _ 100 _ Quarter 2 _ X _ Right _ Prices _ Under _ Trading _ Venue _ OANDS
$18,849.7 will be the next price and will create a bearish candle.
We will then expecting the following prices:
$19,416.4
$19,773.3
$20,098.9
$20,292.2
$20,483.9
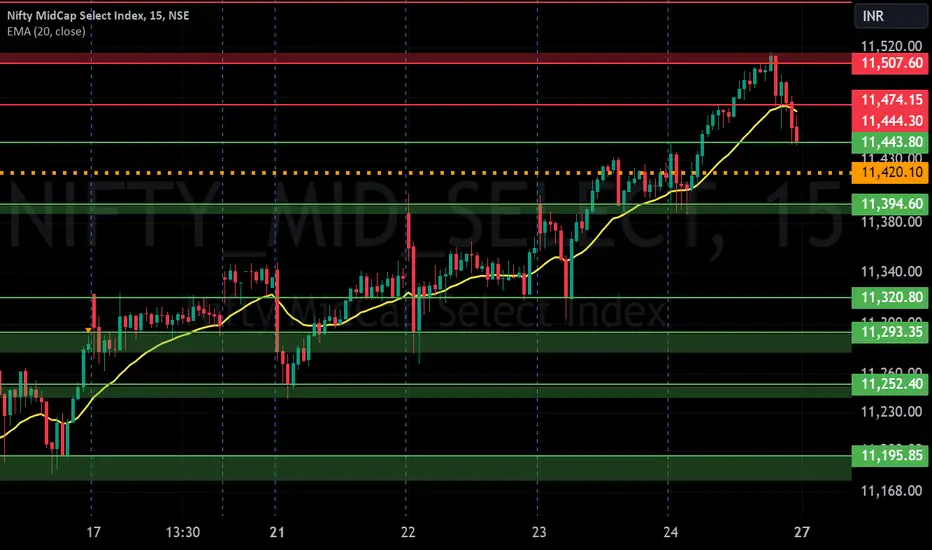
NIFTY MIDCAP S/R for 27/5/24Support and Resistance Levels: In technical analysis, support and resistance levels are significant price levels where buying or selling interest tends to be strong. They are identified based on previous price levels where the price has shown a tendency to reverse or find support.
Support levels are represented by the green line and green shade, indicating areas where buying interest may emerge to prevent further price decline.
Resistance levels are represented by the red line and red shade, indicating areas where selling pressure may arise to prevent further price increases. Traders often consider these levels as potential buying or selling opportunities.
Breakouts: Breakouts occur when the price convincingly moves above a resistance level (red shade) or below a support level (green shade). A bullish breakout above resistance suggests the potential for further price increases, while a bearish breakout below support suggests the potential for further price declines. Traders pay attention to these breakout signals as they may indicate the start of a new trend or significant price movement.
Disclosure: I am not SEBI registered. The information provided here is for learning purposes only and should not be interpreted as financial advice. It is important to consult with a qualified financial advisor before making any investment decisions. Tweets neither advice nor endorsement.
FIN NIFTY S/R for 27/5/24Support and Resistance Levels: In technical analysis, support and resistance levels are significant price levels where buying or selling interest tends to be strong. They are identified based on previous price levels where the price has shown a tendency to reverse or find support.
Support levels are represented by the green line and green shade, indicating areas where buying interest may emerge to prevent further price decline.
Resistance levels are represented by the red line and red shade, indicating areas where selling pressure may arise to prevent further price increases. Traders often consider these levels as potential buying or selling opportunities.
Breakouts: Breakouts occur when the price convincingly moves above a resistance level (red shade) or below a support level (green shade). A bullish breakout above resistance suggests the potential for further price increases, while a bearish breakout below support suggests the potential for further price declines. Traders pay attention to these breakout signals as they may indicate the start of a new trend or significant price movement.
Disclosure: I am not SEBI registered. The information provided here is for learning purposes only and should not be interpreted as financial advice. It is important to consult with a qualified financial advisor before making any investment decisions. Tweets neither advice nor endorsement.
