Market indices

US30 06+06+2024 The Probable FallThis is an overall view of the trader H4Hubert.
As shown, US30 showing weakness to go higher.
Let's see what happens.

bullish idea bullish momentum on multiple timeframes with good risk to reward ratio, daily,h4 and h1 all to the upside, will be looking to add more if position starts moving as anticipated and milk the cow on this one

Usd wycoft spring Usd right now is undervalued. Usa is working on repairs of it's American hardwork culture.
My bias is bullish Usd.
There is no better system that exists so far right now.
All that is left is a push to the moon.
I do hope to see Usa awakening from the woke mind virus.


NIFTY DAILY - 6/6/2024Index opens with gap up and made days high which is 22910 level but market was highly volatile so nifty made day’s low which is 22642 level.
Nifty was up by almost 270 points which is Approx 1%, nifty gave closing around 22821 level with 200 points plus.
Nifty has formed small bullish candle with upper and lower shadow on daily chart.
Candle is trading above Middle Band of Bollinger Band. Nifty has broken the resistance of 22794 so, further 22059 will work as resistance level with support of 22635 level.
Bank Nifty levels
Support – 48568 Resistance – 49334
Today’s Advance Decline ratio of NIFTY50
Advance - 38
Decline - 12
FII Sell – 6867.72 crores
DII Buy + 3718.38 crores.
⚠️ Important: Always maintain your Risk & Reward Ratio.
✅Like and follow to never miss a new idea!✅
Disclaimer: I am not SEBI Registered Advisor. My posts are purely for training and educational purposes.
Eat🍜 Sleep😴 TradingView📈 Repeat 🔁
Happy learning with trading. Cheers!🥂

Dollar Index Analysis for Tomorrow NFP/Unemployment RatesFor tomorrow's economic data release in the U.S., the focus is on the Non-Farm Payrolls (NFP) and the unemployment rate. These are key indicators of the labor market's health and have significant implications for the economy and financial markets.
If the NFP report is extremely positive, showing a much higher number of jobs added than expected, it indicates a strong labor market. This could lead to several outcomes:
- *U.S. Dollar:* The dollar is likely to strengthen as a robust labor market suggests economic growth and may increase the likelihood of higher interest rates.
- *Federal Reserve:* The Fed might consider raising interest rates sooner or more aggressively to prevent the economy from overheating and to keep inflation in check.
On the other hand, if the NFP report is extremely negative, showing a much lower number of jobs added than expected or even job losses, the implications would be quite different:
- *U.S. Dollar:* The dollar may weaken as a weak labor market suggests economic challenges and reduces the likelihood of near-term interest rate hikes.
- *Federal Reserve:* The Fed might maintain or even lower interest rates to support economic growth and improve labor market conditions.
The unemployment rate also plays a crucial role. A lower-than-expected unemployment rate would typically support the case for a stronger dollar and potential rate hikes, while a higher rate would likely prompt a more cautious or dovish stance from the Fed.
In summary, the actual data from the NFP and unemployment rate reports tomorrow will significantly influence market expectations and the Federal Reserve's policy decisions. A positive report would likely boost the dollar and push the Fed toward tighter monetary policy, while a negative report would likely weaken the dollar and prompt more supportive measures from the Fed.

NASDAQ INDEX (US100): To The Next Highs
One more instrument that we discussed on the today's live stream
is US100 Index.
This week, the market updated the all-time high, violating a key horizontal resistance.
With a very bullish fundamental data, the Index has a nice growth potential.
Next resistance - 19300
❤️Please, support my work with like, thank you!❤️

DXY : What the price action saysLooking at price action tells me what the MARKET is thinking/doing. These past few days has not been easy to 'predict' movement because opposing the market are those who wish to see a weakening of the $ to drive down yield.
Anyway, lets stick with the MARKET and trade accordingly.
In all probabilities, we can see that the DXY will move higher in the coming weeks, most likely beating the previous highs.
Good luck.

DXY Thursday 6 June Initial Jobless claims This is going off the basis of a bearish reading in Initial Jobless Claims. If it’s bullish it could reverse at the daily volume imbalance. If it’s bullish it will push through it and take sell-side liquidity.

NIFTY : Trading Plan and Levels for 06-Jun-2024
Key Levels:
Immediate Resistance/Profit Booking Zone:
22,875
22,814
22,716
Immediate Support/Buyer's Zone:
22,423
22,381.65
22,329
22,293
Projected Moves:
Bullish Scenario:
If the price breaks above 22,716 and sustains, it is likely to move towards the resistance/profit booking zone between 22,814 and 22,875.
Strong bullish momentum above 22,875 could indicate further upside potential.
Bearish Scenario:
If the price fails to sustain above 22,716 and shows rejection, it might fall back towards the support levels starting at 22,423.
A break below 22,423 could see the index moving down towards 22,329 and potentially lower.
Trading Plan:
Opening Trade:
Monitor the price action around the opening levels.
Long Position:
Enter a long position if the price shows bullish strength above 22,716 with a target of 22,814 to 22,875.
Place a stop-loss below 22,716.
Short Position:
Enter a short position if the price shows bearish rejection at 22,716 with a target of 22,423.
Place a stop-loss above 22,716.
Breakout Trade:
If the price breaks above 22,814 and sustains, consider entering a long position targeting 22,875.
If the price breaks below 22,423, enter a short position targeting 22,329, with an extended target of 22,293.
Intraday Adjustments:
Adjust stop-loss levels to breakeven once the first target is reached to protect profits.
Use trailing stop-losses to capture extended moves beyond key levels.
Scenarios to Avoid:
Avoid trading in a no-trade zone around 22,716 if there is low volume or indecisive price action.
Be cautious of false breakouts, especially around key levels, and wait for confirmation before entering trades.
Risk Management:
Use proper risk management strategies, such as risking only a small percentage of your trading capital on each trade.
Adjust position sizes based on the volatility and risk associated with each trade.
Disclaimer:
The information provided here is for educational purposes only and does not constitute financial advice. Trading in financial markets involves risk, and you should only trade with money you can afford to lose. Always conduct your own analysis and consult with a financial advisor before making any trading decisions. The author is not responsible for any losses incurred due to trading based on the information provided.


The End & The BeginningThis will be our final public post
The collapse of modern society and capitalism has begun
We must focus on preparation
May you all be safe

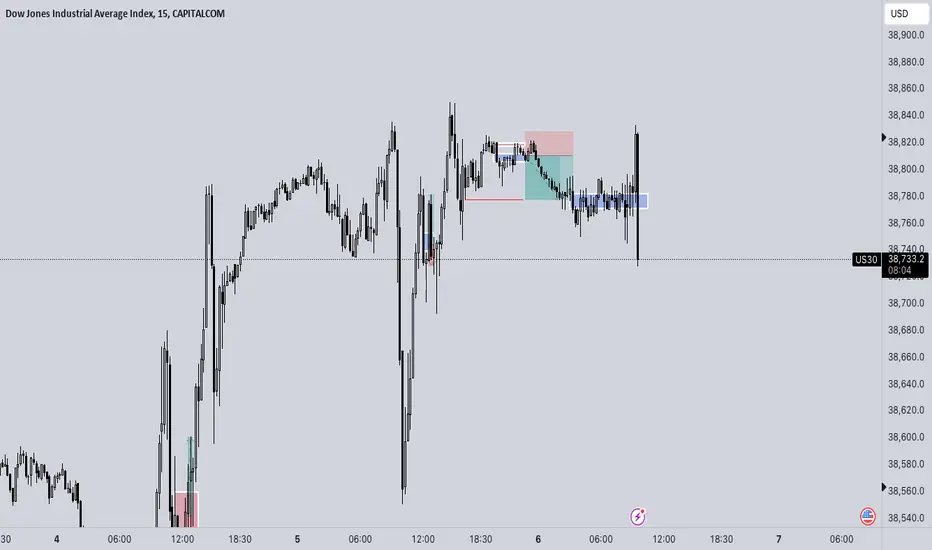
US30 - Under ADP PressureUS30
The price reached their resistance which is 38790 after realizing Job opening negatively,
Today the market will move under ADP pressure which expected with Negativity for USD, that means will support more bullish for indices
However, the price will try to do a retest till 38580 and then will consolidate between 38580 and 38790 till breaking.
Bullish scenario: stability above 38790 means uptrend to get 39050 and 39350
Bearish scenario: the price should break 38580 to get 38400 and then stability under 38400 means will be a downward area.
Pivot line: 38790
Resistance line: 39050, 39360, 39780
Support line: 38580, 38400, 38050
Today’s movement will be between support 38400 and Resistance 39350


US 30 - Ranges overview We just got the NY open and we've now taken both sides of the market.
Watch how we react from the 15min breaker (blue box)
Don't hesitate to zoom out for the HTF sellside liquidity and buyside liquidity.
Stay safe and never risk more than 1-5% of your capital per trade. The following analysis is merely a price action based analysis and does not constitute financial advice in any form.
#Banknifty:7th June#Banknifty:7th June.
Step1: In case G/D..keep S1-49008. Long zone.
Step2: 49625-R1 exit point.
Step3: if G/U 49625 is support...if sustained get long.
Step4: 50383-R2 swing high possible.

Bulls and Bears zone for 06-06-2024S&P has been moving upwards this week and made a New ATH yesterday. Any test of yesterday's Close could provide some direction for today.
Level to watch: 5364 --- 5362


Trading hours/ Trading scheduleWhy is it Important to Have a Clear Trading Schedule?
Avoid Costly Mistakes: When you're tired, you're more likely to make errors that could cost you money.
Market Expectations: Market behavior can vary greatly depending on the time of day and market hours, so it's essential to plan accordingly.
Market Hunts: Certain times of the day are prone to market hunts, where sudden movements can make it hard to control outcomes.
Opening Opportunities: Each market opening presents its own opportunities and challenges.
Time Zone Considerations: Your time zone and personal preferences might not align with every market opening, so it's crucial to choose your trading times wisely.
When Do I Trade? (GMT+2)
London late Session/ NY preopening: 12:00 - 1:30 PM
London-New York Overlap: 4:00 - 7:00 PM
Chart Analysis for the Next Day: Around 9:00 PM, sometimes with overnight trades if I see opportunity.
When Are the Hunts? (Avoid trading at those hours)
0:30 - 2:00 AM
8:30 - 10:00 AM
1:30 - 3:00 PM
8:30 - 10:00 PM
When Are the Best Hours in General?
Apart from evening sessions, consider trading during:
Asian Session (Tokyo-Sydney Overlap): 3:00 - 6:00 AM
London (-Opening): 7:00 - 8:30 AM and 10:00 - 11:00 AM
Having a structured trading schedule helps you stay focused, reduces errors, and maximizes your chances of success in the market. Happy trading!

US30 ( UPWARD)US30
Tendency the price is a long pressure in between 38,680 and 38,560
Turning level : The turning level between 38,680 and 38,560 so as long as the price above this level, there will be a bullish trend , but braking 38,569 , the price comes downward pressure
resistance level : trade above turning level between 38,680 and 38,560 , the price will rise to 39,015 and 39,185
support level : braking a turning level 38,560, the price will reach the support level of 38,280
and 37,940
corrective level : price will attempt between 38,680 and 38,560 , correct itself before long

USSPX ( BULLISH TREND PRESSURE )USSPX
Tendency the price is a long in 5,336
Turning level : The turning 5,336, so as long as the price trending above this level, there will be a bullish trend
resistance level : trade above 5,336 , the price will up to 5,375, then trending in this level touch a 5,400
support level : braking a turning level 5,336 ,the price will reach the support level of
5,300 and 5,252
corrective level : price will attempt 5,336 , correct itself before long , then create a new historical price

Doji candle formed in Nifty today. Does it indicate upside?Today we saw a formation of Doji candle in Nifty. Doji candles indicates uncertainty. Colour of the Doji candle shows the bias which is green as of now. So the bias still remains positive with formation of stable government on cards. However on any new or noise from coalition allies the Bears can make a strong comeback. Doji today indicates that Bears are also equally active and are waiting for their chance of action. So be aware / be conservative in your choice of stocks. In terms of Cricket if we consider this a T-20 match this pitch is not a 200+ pitch. It is rather a green top where if a team scores 150-170 runs they can be difficult to chase. So what should investors do? They should keep stop losses. Stop losses are the best friends. Keep stop losses and trailing stop losses. Stop losses protect your capital. Trailing stop losses protect your profits.
Nifty Resistance Levels: 22910, 23053, 23192, 23338.
Nifty Support Levels: 22630, 22456, 22139, 21781 and 21277.
Below 21277 is a bear territory and absolute hunting ground of bears.
