Down trendSPX going downwards looks week to me any opions? Looks like there was also a huge 5 minute red volume spike yesterday durign trading open, that seems suspicious to me no? but its gotta bounce the market is great! infaltions going down!
US500 trade ideas

Sell set up for spx500Looking to see if we will get a retest back to the previous lower high structure. If the markets close back outside of the zone, then this will be my sell set up that I will take

SP500 - Bullish Outlook - Bullish DivergenceVANTAGE:SP500 is in a strong bullish trend. After retracing on smaller timeframes, price formed bullish divergence and broken the last higher high for the first time before retracing from a resistance trend line. Expecting the price to retrace early next week, followed by bullish price action.
Looks Like A Double Double Trouble In The SPX Daily.What's up Traders? I mean down! Yep SPX making another go at falling short. Get it? Lol!
Here we may go people! Looking double double bubble this time.
2 double tops on the SPX daily Oanda chart. Little brother and big brother. Which one of those bears are going to attack?
Let's start with 5120.5 area first.
Second 4951 area.
Third 4829.6 area if big brother jumps in this fight.
If we go past that I will post something based on what I see from there.
Trade careful out there and best of luck in all your trades.

The correction down for SPX500USD has startedHi traders,
Last week SPX500USD went up a little more but dropped on Thursday just like I've said in the outlook last week. So now the correction has started we have to wait for the finish of it.
Trade idea: Wait for the finish of a correction down to trade longs.
If you want to learn more about wave analysis, please make sure to follow me, give a like and respectful comment.
This shared post is only my point of view on what could be the next move in this pair based on my analysis. I do not provide signals.
Don't be emotional, just trade!
Eduwave


S&P 500 Falls 0.7% Amid Investor Uncertainty S&P 500 Falls 0.7% Amid Investor Uncertainty
The S&P 500 OANDA:SPX500USD declined by 0.7% on a subdued Thursday as investors adjusted their portfolios amid fluctuating market sentiment. The trading session was marked by an uneasy atmosphere following the release of the Federal Reserve's latest meeting minutes, which indicated that central bankers are not in a hurry to reduce interest rates . This cautious stance from the Fed has been a key factor in supporting the recent upward trend in stocks.
Technically Side:
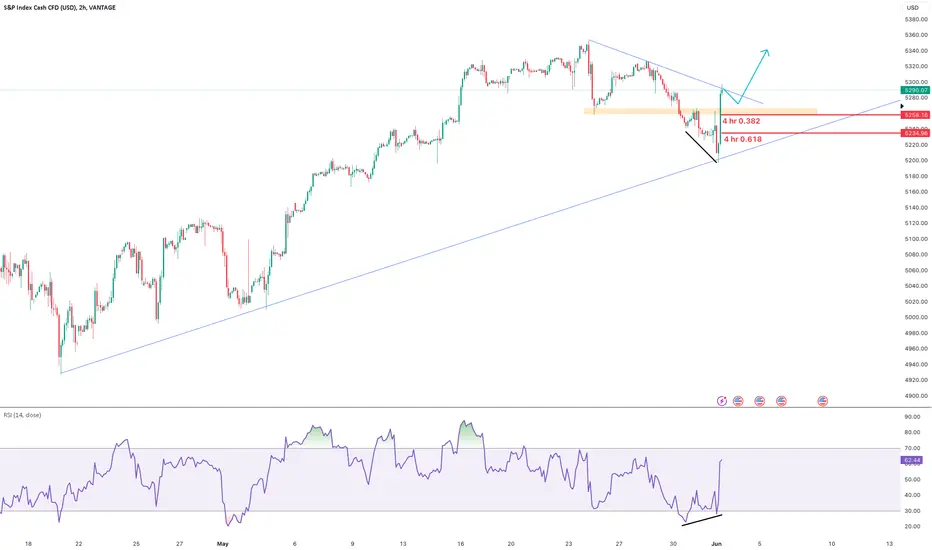
The price has declined and reached the breakout zone, indicating a potential return to the 5266 level. To continue the bearish trend, the price must break below 5266, confirmed by closing a 4-hour or 1-hour candle under this level. If this occurs, the next targets would be 5226 and 5193.
Conversely, if the price closes above 5282, it would suggest a bullish trend, with the potential to reach 5307 and subsequently 5320.
Pivot Line: 5282
Resistance Levels: 5305, 5325, 5350
Support Levels: 5245, 5227, 5193
Today’s expected trading range is between the support 5192 and the resistance 5320.

S&P 500 Analysis: Good News is Bad NewsS&P 500 Analysis: Good News is Bad News
Yesterday, S&P Global reported its Purchasing Managers' Index (PMI) values for the US, which exceeded expectations. According to ForexFactory:
→ Manufacturing PMI: actual = 50.9; expected = 50.0; previous = 50.0.
→ Services PMI: actual = 54.8 (the highest value since May 2023); expected = 51.2; previous = 51.3.
However, the high PMI values, indicating a healthy economy, led to a drop in the stock index. The S&P 500 index (US SPX 500 mini on FXOpen) fell by more than 1.5% following the publication.
What explains this case of "good news is bad news"?
The point is, amid high business activity, manufacturers reported rising prices for a range of resources, suggesting that goods inflation might strengthen in the coming months. Stock market participants might have interpreted this as a reason for the Federal Reserve to maintain high rates for a longer period – hence the sharp decline in the index.
"Companies remain cautious with respect to the economic outlook amid uncertainty over the future path of inflation and interest rates, and continue to cite worries over geopolitical instabilities and the presidential election," said Chris Williamson, Chief Business Economist at S&P Global Market Intelligence, in an interview with Reuters.
Technical analysis of the S&P 500 chart today (US SPX 500 mini on FXOpen) shows that:
→ the price has been forming an ascending channel since 19 April (shown in blue);
→ bulls failed to hold above the March high around the 5285 level (a bearish sign);
→ the psychological level of 5300, which showed signs of support this week, has now been breached and may act as resistance. Conversely, the 5200 level, after being breached, has shifted its role from resistance to support (as indicated by arrows).
So far, the bearish momentum that emerged yesterday following the PMI news release is being contained at the median line of the blue channel. But if sentiment does not change today, the median might be breached, and then the path to the lower boundary of the channel will open for the S&P 500 price (US SPX 500 mini on FXOpen).
Trade global index CFDs with zero commission and tight spreads. Open your FXOpen account now or learn more about trading index CFDs with FXOpen.
This article represents the opinion of the Companies operating under the FXOpen brand only. It is not to be construed as an offer, solicitation, or recommendation with respect to products and services provided by the Companies operating under the FXOpen brand, nor is it to be considered financial advice.

SPX Showing Signs of Weakness at PCZ of a Bearish Alternate BatThe RSI on the daily has begun to rollover as the SPX appears to have rejected off of the Bearish Alternate Bat HOP level. There does not appear to be much nearby support within the range the SPX is currently trading in so if it gets back below the previous All-Time High I could see it coming back down to around $5100 maybe even $5000 - $4800. This all seems to be brought on by the increase in JGB Yields disrupting the Carry Trade. We may see them try to stabilize the carry trade around $5100 but there is a heightened chance of failure.
More on the carry trade can be seen in the related idea below.

Aggregate Rate of Return All 401(k) PlansThe purpose of this chart is to show how retirement funds are drained once returns reach 20%.
The reason this happens is because the purpose of the 401(k) is to prevent working people from ever reaching anything that resembles financial independence.
From the time we begin our careers to the time that we reach retirement age, we are CONSTANTLY told that if we do NOT use the 401(k), we are "leaving free money on the table".
But look at the chart.
The reality is: retirement funds get drained, people lose their life savings ('08), and big institutional funds (supposedly fiduciaries) get bailed out, WHILE YOU LOSE EVERYTHING YOU WORKED TO BUILD.
All I'm saying is: if you work with a "financial professional", you have a right to ask questions. You have a right to seek answers. You have a right to know what THEIR plan is for YOUR money.
Look at the S&P 500.
Ask your advisor: What causes these massive drops? Why does this occur? Am I protected?
I will build on this in my subsequent chart publishing.

SPX in 6M chart.Hello everyone
I know if I show you this time frame it might be possible that some of you criticize me but it is my wavy and I always get good views for my next months.
One important thing is that all technical and elliott rulse are becomes more reliable as long as you go to higher timeframes.
In this chart, we are in a break out candle (I named it) that will remain for 2 month and it has just 2 choice.
1: goes up and confirms our break out and rally
2: goes down and make a bearish pin bar
According to Elliott principle, we know that after a correction we should have another trend (Rally for up trends) and then repeat it again because unlike Forex market that is most of Corrective patterns, in the stock, securities, and so on we just ave up trends (In large timeframes).
If you consider this huge bearish candle that started at 4820.40 USD, as a correction (Probably Wave 2 Grand Cycle) then it is rare that this correction in where we are can make another bearish RED candle in this chart.
To be clear, I think we will pass a shallow correction and continue to the rally (With Crypto Market).
Maybe I right Maybe not
Just time can reveal that.
Thanks

S&P500 Short-term buy opportunityThe S&P500 (SPX) index gave us an excellent bottom buy signal on May 02 (see chart below) that comfortably hit our 5200 Target:
The pattern that prevailed is a Channel Up, holding since the start of the month. As long as it is supported by the 4H MA50 (blue trend-line) and the 4H RSI Rectangle holds, we expect the current consolidation to give a similar 2.0 Fibonacci extension Target at 5370, such as the May 10 High.
-------------------------------------------------------------------------------
** Please LIKE 👍, FOLLOW ✅, SHARE 🙌 and COMMENT ✍ if you enjoy this idea! Also share your ideas and charts in the comments section below! This is best way to keep it relevant, support us, keep the content here free and allow the idea to reach as many people as possible. **
-------------------------------------------------------------------------------
💸💸💸💸💸💸
👇 👇 👇 👇 👇 👇

Myth Busting: Market Style!I have been very lacking in producing educational content. I know a lot of you follow for my analysis, some others for my indicators and some others for my educational content. While I have been getting back in the groove of posting for the later 2, I have neglected those interested in educational content.
So voila, here we are with an educational post! In this post, I want to dispel and or validate some market conjecture based on actual research and my own observations, from indicators, to chart patterns to different market theories. The post will be formatted in the great MYTH BUSTER format!
Hope you enjoy!
Myth #1: All indicators are interchangeable and one indicator can be used for any type of equity.
You all likely have seen, whether on tradingview or other sites, the magical indicators that “work in all markets!”. And you tell yourself, “oh wow, too good to be true, right?!” And the fact is, it is too good to be true. This is a myth and is absolutely false. No one indicator will be cross compatible for multiple different equity types. No one indicator will be sufficient even within the same equity types (i.e. just because RSI works for MSFT doesn’t mean it will work for NVDA).
You can actually objectively view this for yourself if you apply my ATREE indicator . Just as a quick explanation, the ATREE indicator uses MFI, Stochastics, RSI and Z-Score to determine sentiment. It will also provide you with back-test results as to how effective it is at gauging sentiment based on these individuals technical. If we look at ATREE for NVDA:
Pay attention to the backtest results on the right side of the screen. These provide the raw success rate of its sentiment estimations. For NVDA, we can see that Stochastics can predict sentiment roughly 76% of the time on the daily timeframe. However, if we flip on over to MSFT
We see that Z-Score is actually much more effective at determining sentiment than RSI, Stochastics or MFI. This is just an example, but to show you another one, let’s take the Ichimoku cloud with buy and sell signals and put it on MSFT:
We can see, it nailed the buy but pretty hit or miss for the sell. I wouldn’t say this is a great indicator to use for MSFT shorting. However, if we flip on over to SPY with the same indicator:
Its been a bit more on point.
Understanding unique individual ticker intricacies is my whole shebang. I produce models to predict sentiment. If you are part of my community you know there are 4 commonly used models that we employ, from LSTM, to ARIMA, to Eucledian Distance models to Momentum Technical Models. Not all are equal for all stocks. For example, we will reference momentum for tickers like NVDA, but Eucledian distance is better for tickers like SPY. How do you figure this out? Backtesting! I’ve said it in other educational ideas and I saw it again, you always need to backtest your strategy!
Myth #1 Verdict:
So, are all indicators good for all markets?
NO! This is BUSTED!
Myth #2: Trendlines and chart patterns are helpful and pivotal for trading stocks
There tends to two schools of thought to this. Train 1 is that trendlines are pivotal for trading and making assumptions. Train 2 of thought is that they are not helpful and quite frankly useless. However, in mainstream trading theory and teachings, trendlines are a often cited and often taught method of market determination. But are they useful?
Well, it depends. Trendlines can give us context, without trendlines we would have no context and would just be trading random candles on a blank space. The degree of efficacy of these trendlines can depend on things like:
a) The duration of the trend,
b) The skill of the chartist,
c) The number of tests of the trendline,
d) The overall economic climate that a stock is in.
Obviously, I personally found trendlines problematic, hence my resorting to computer modelling. However, in my years of experience and my maturity in the market, I reapproached the trendline theory as supplemental to modelling and have made some relevant observations, which I will discuss below.
The first point is that not all tickers are created equal. Sound familiar? Yeah this was the basis of Myth #1 about technical indicators. The truth is, it applies to trendlines, too. Let’s take a look at DUO, a small cap stock:
DUO recently did, arguably, a dead cat bounce and produced this pennant you see in the chart above. Now DUO is small cap, low volume stock that barely moves. Suddenly, we have this pennant out of nowhere and with no major catalyst. So what happened?
Nothing, it ended up selling into EOD multiple times.
Let’s take a look at NVDA:
NVDA broke down from a major trendline around April 3rd. This would signal a short. And indeed, it was a short, for a short duration of time. It mostly was rangy and stagnant. But it did sell. This trendline was from January of 2024 and ended in April of 2024, a relatively long and stable trendline. NVDA is also a large cap stock with huge amounts of liquidity and volume, So we can expect follow through on major trendlines.
Trendlines have also been pivotal for intra-day trading. Let’s look back at NVDA (since its my daily go to for day trading):
During open, on the 1 minute chart, we could see NVDA forming a pennant. Based on the modelled data we had two potential price targets, a bull target of 957 and a bear target of 929. What NVDA does with this pennant (breakout or breakdown) can help us ascertain which target price is correct.
What happened?
NVDA broke down, and then it travelled all the way down to that 929 target:
So it would seem that chart patterns are indeed useful. However, they are not overly helpful with indicating target price, As well, they are only useful when the stock has high volume, good liquidity and is heavily traded. The efficacy of trendlines and chart patterns likely comes from volume of traders who are looking at similar trendlines. In order for trendlines to influence a stock movement, you need volume from traders who are paying attention to the same thing in order to move it. This is why penny stocks and low float, small cap stocks do not respect trendlines and patterns in the same way.
Verdict for Myth #2?
CONFIRMED!
Myth #3: Market theories such as Elliot Wave Theory (EWT) and Efficient Market Theory are applicable to all tickers and the market as a whole?
If you are a trader, likely you subscribe to one market theory or another. If you are investor, its likely you subscribe to modern portfolio management theory (which emphasizes diversification). If you are a day or swing trader, perhaps you subscribe to the Efficient Market Hypothesis or EWT.
These all remain “theories” because they have yet to prove valid or invalid in research. However, aside from the investor mindset of diversification, no one theory of the market works for all tickers. In fact, some research has come out about EWT specifically and has indicated that it can be useful in predicting some markets (such as the S&P); however, the results are not generalizable to others (specifically Crypto and some individual tickers).
The same can be said about the efficient market theory/hypothesis and many others that have been researched, disproven in some circumstances and proven in others.
So, what is the verdict here?
This is BUSTED. Market theories, aside from an investor mindsight, are not generalizable to all equities, instruments and markets. This is semi based on my own observations but mostly from academic research I have reviewed on this topic (hence why I have no beautiful charts to display for this myth).
And the last myth I will cover in this post:
Myth #4: Diversification is pivotal for day traders
The wisdom here is that, you need to diversify for day trading. You need to identify setups on whatever stock has those setups and play whichever stock confirms best to your setup. The truth is, this is rarely necessary. In fact, sticking to a handful of routine stocks can be advantageous, as you will grow to learn the intricacies of the particular stocks you are trading routinely.
I go through phases but right now, 99% of the time I am trading NVDA. This works for me because there is usually always a setup available on large cap stocks. Let’s review some of the setups I have taken on NVDA:
You can see NVDA loves its morning triangles, and I love them too!
You can absolutely get back with trading one ticker, provided that it has good volatility and movement. In times of economic stability (i.e. currently), its best to avoid the indices as a day trading candidate as they tend to move slower and more purposefully.
So what is the verdict of Myth #4?
Thanks for reading everyone!
I may do more of these myth buster posts, they’re fun to research and find examples and really reflect on what I have learned as a trader. Feel free to submit any myths you live by in the comments and I can look into them for maybe a future post!
Safe trades as always!

S&P500: Wait for the ideal level to rebuy.The S&P500 index is neutral on its 1D technical outlook (RSI = 44.135, MACD = 2.270, ADX = 26.567) despite the fact that it made a new All Time High, in fact turning the former R level into S. The uptrend is being supported by the 4H MA50 since the May 2nd breakout and the Channel Up presents a new low risk buy opportunity close to the 4H MA100, ideally when the 4H RSI approaches the 30.000 limit. We will wait for the opportunity to go long and target the top of the Channel Up (TP = 5,400).
See how our prior idea has worked out:
## If you like our free content follow our profile to get more daily ideas. ##
## Comments and likes are greatly appreciated. ##

Add long SQQQ May 31st $10.50+ Calls HereI bought long SQQQ $10-$10.50 May 24th to 31st calls this morning, if we hit 5400 i'll add.
The VIX is bouncing as suspected at $12 and the S&P500 wants to dip below and confirm a 5300 fake out which was my bias and the DOW (DJIA) wants to do the same at 40k
bitcoin is faking out above 67500 into an expanded flat pointing to my 63,300-63,500 short term short trajectory

Fib LevelsNot even gonna guess how high will it fly. Got higher than we expected already. Smoked bears, gone into hibernation.
Here are the fib levels for your consideration. Notice price approaches the top Bolly Band.
Not a lot of room left to squeeze but it could pump higher.
Not overbought yet. Short when it gets there. Bewary.

S&P 500 Daily Chart Analysis For Week of May 24, 2024Technical Analysis and Outlook:
The S&P 500 reached our projected Outer Index Rally at 5342 and then quickly retraced as part of the primary reignited squeeze move path. It is unlikely that it will drop to the primary down target Mean Support at 5221. However, it may continue to advance towards the completed Outer Index Rally at 5342, the Inner Index Rally at 5408, and the next Outer Index Rally at 5450. The secondary reignited squeeze triggering points are at specified destination pinpoints.

New all time highs in MaySPX is heading to new all time high by May 21. Invalidated if breaks below Apr 19 low.

SPX Big Short 2Two years after my last big short on SPX, the price has once again reached the top of the ascending channel. Based on this scenario , the expectation is that SPX will peak within the next two months , around early May 2024.
Initial target 4,800, stretch 4,400
Incidentally, Bitcoin appears poised to surpass its 2021 all-time high, during which Bitcoin peaked two months prior to the SPX 2022 high.
Coincidence? Possibly
Best, Hard Forky

SPX Is Going Down! Sell!
Take a look at our analysis for SPX.
Time Frame: 1D
Current Trend: Bearish
Sentiment: Overbought (based on 7-period RSI)
Forecast: Bearish
The market is approaching a key horizontal level 5,303.24.
Considering the today's price action, probabilities will be high to see a movement to 5,089.73.
P.S
We determine oversold/overbought condition with RSI indicator.
When it drops below 30 - the market is considered to be oversold.
When it bounces above 70 - the market is considered to be overbought.
Like and subscribe and comment my ideas if you enjoy them!

SPX500 - Bullish Stancehe SPX500 has undergone a consolidation phase after a bullish trend, displaying choppy price movements. Notable patterns emerged, including a triple top formation with bearish divergence followed by an ascending triangle, indicating a potential continuation of the uptrend. Amidst cautious trading sentiments, a failed breakout from the triangle pattern hinted at a possible rectangle formation, supporting bullish continuation. Currently, the market has broken above the triple top, presenting a favorable opportunity for long positions, either immediately or upon a retest of the support level. With minimal resistance ahead, traders can consider riding the bullish momentum until signs of bearishness materialize, thereby capitalizing on the prevailing uptrend.

Bad data is good data... but for how long?Following better-than-expected inflation print for April 2024, investors found once again an excuse for relatively bad data to be good for the market in anticipation of rate cuts, causing the S&P 500 Index (SPX) and other indices to soar to new all-time highs. However, just three or four months ago, the general expectations were for seven rate cuts in 2024, something we quickly ruled out when these assumptions emerged. After data in the first quarter revealed sticky inflation numbers, these expectations dropped dramatically to only one or two rate cuts by the year’s end. Thus, by now, it should probably be out of the question whether the Federal Reserve will continue to prioritize controlling inflation over unemployment, which has also been slowly rising. In fact, the unemployment rate rose to 3.9% last month, reaching the highest level since early 2022, when excluding the same print for February 2024. Yet, while the 0.5% increase from the lows does not seem significant, historically, a 1% rise in unemployment has been typically accompanied by a recession. Therefore, even though the rate of increase is slow, unemployment is moving in a concerning direction. Besides that, U-6 unemployment is growing much faster, and there are many other discrepancies in the labor market data, which could potentially hint at a much worse state of the economy that is being reported.
Illustration 1.01
The monthly graph of the unemployment rate in the United States is shown above.
Another interesting detail is that retail sales remained unchanged in April 2024 from the previous month, and the yearly change amounted to 3%, while inflation rose by 3.4% during the same period. In addition to that, the United States ISM PMI contracted last month, and expansion in the United States S&P Global Composite PMI eased. Again, while these are not outright horrible developments, the economic slowdown will likely become even more apparent in the coming months as the FED keeps a tight monetary policy for longer, putting additional pressure on economic activity and exacerbating the challenges faced by various sectors and consumers. With that, the question lingers over how much longer investors will continue to interpret bad data as good in anticipation of something that is not coming and will only serve to confirm the economy is really not faring that well when it comes.
Illustration 1.02
One of the challenges in the current environment is debt servicing. This fact is strongly reflected in soaring delinquencies on credit card loans, which have nearly doubled since the Federal Reserve started the hiking cycle.
Technical conditions
Daily time frame = Bullish
Weekly time frame = Bullish
Monthly time frame = Bullish
Please feel free to express your ideas and thoughts in the comment section.
DISCLAIMER: This analysis is not intended to encourage any buying or selling of any particular securities. Furthermore, it should not be a basis for taking any trade action by an individual investor or any other entity. Therefore, your own due diligence is highly advised before entering a trade.

S&P500 VISION 22/05 On May 15, the SPX500 index broke through its previous ATH of 5286.
I had announced this a few days earlier in one of my analyses.
For the past 1 week, we've been in an accumulation phase (which is normal, given what's just happened).
Here's the configuration I'm expecting:
✅ Liquidation of the bottom of the range
✅ Return to Fibonacci 0.62
✅ Reaction on H1 order block
I'd therefore prefer to buy in the $5250 area!
Feel free to subscribe and put a boost on this post if you enjoyed my analysis, and let me know what you think!
Good trading and have a good week :)
