EURCAD We are looking for buying opportunities, for as long we are still inside a bullish trendline we going to expect buys if the market breaks the bullish trendline we will be looking for selling opportunities
EURCAD trade ideas

📈 EUR/CAD Breakout Play on the 4-Hour ChartHey traders, let’s dive into EUR/CAD as we see some intriguing action on the 4-hour timeframe. We’re eyeing a potential breakout, so here’s the scoop:
✅ Breakout Potential: The pair is tightening up, forming what seems to be an ascending triangle pattern, pushing against the yellow resistance line at 1.48185. A decisive breakout above this resistance could set up a nice move. Watch for a solid 4-hour candle close above this level to confirm bullish intent.
🔍 Entry Point: If we get our breakout, the entry would be just above the 1.48185 mark, post-confirmation.
🛑 Stop-Loss: To keep things tight, consider placing a stop-loss just below the most recent swing low at around 1.47717 to minimize risk.
🎯 Take Profit: Initial profit targets might look towards the next significant resistance level marked at 1.48590. If the momentum holds, the upper yellow line could be the next stop.
📉 Market Sentiment: Keep an eye on overall market sentiment and any news affecting the Euro or Canadian Dollar, as these could influence price action significantly.

EUR/CAD will go For Correction Wavewe have two scenario
First scenario : price will pull-back for correction wave and create higher low at black arrow or between 50:61 fibo level , so u can go short now and take any target or when confirming higher low in H4
second scenario : price will break current resistance area green arrow may be powered by news for CAD that will price to go up and we can go long and take any target
i personally prefer to go with low lot with first scenario and go with high lot with second scenario because second is walking with general up trend but i can take a trade with correction wave
have fun :)

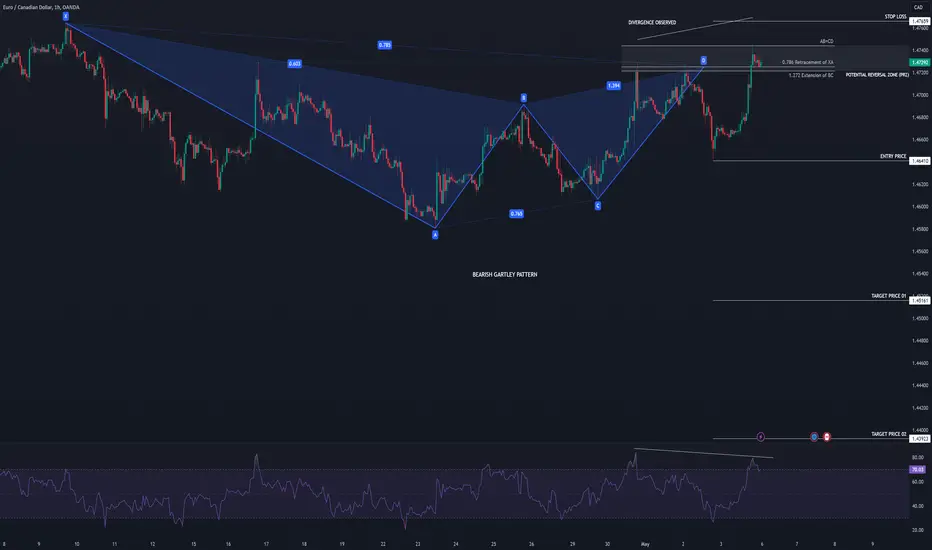
EURCAD - Bearish Reversal - 20/05/2024USDCAD has been trading in a strong Bullish Trend. No divergence Divergence has been observed on the 1 hour RSI.
The price action currently seems to be printing new lows - a potential reversal into a strong Bearish Trend.
If the price action breaks out the 1.47493 level, the price could continue in a downward towards the 1.46225 level.
Trade Plan: Short
Entry: 1.47493
SL: 1.48127
TP1: 1.46859
TP2: 1.46225

EURCAD Under Pressure! SELL!
My dear followers,
This is my opinion on the EURCAD next move:
The asset is approaching an important pivot point 1.4778
Bias - Bearish
Safe Stop Loss - 1.4804
Technical Indicators: Supper Trend generates a clear short signal while Pivot Point HL is currently determining the overall Bearish trend of the market.
Goal - 1.4737
About Used Indicators:
For more efficient signals, super-trend is used in combination with other indicators like Pivot Points.
———————————
WISH YOU ALL LUCK

EURCAD BUY BIASPrice has been bullish , making successive HH and HL, hoping to take a long position from any of the zone below, targetng the previous HH,
This is just a financial advice not a signal,
1st zone is a flipzone and its in the premium, and ideally its wrong to take a long from premiums pricing ( tho it's in the discount of the recent range, but i like taking entries from the structural range). So the second zone below is my preferable option as it aligns with the discount of the structural range

EURCAD UPDATE !!!www.tradingview.com
below 1.4800look for further downside 1.4770 & 1.4750 as targets.

EURCAD Is Very Bullish! Buy!
Please, check our technical outlook for EURCAD.
Time Frame: 2h
Current Trend: Bullish
Sentiment: Oversold (based on 7-period RSI)
Forecast: Bullish
The market is approaching a significant support area 1.479.
The underlined horizontal cluster clearly indicates a highly probable bullish movement with target 1.482 level.
P.S
The term oversold refers to a condition where an asset has traded lower in price and has the potential for a price bounce.
Overbought refers to market scenarios where the instrument is traded considerably higher than its fair value. Overvaluation is caused by market sentiments when there is positive news.
Like and subscribe and comment my ideas if you enjoy them!

EURCADEURCAD
we looking for more bullish momentum meaning that we expecting a zone that to be retested

EURCAD LONG
Daily:
- Bullish M
- Clear S&D zone
- Impulse/ correction
- Bullish momentum
Weekly:
- 4/4 criteria
*Weekly wants to go to the W -27
(aligns with Daily -27)
*Very strong resistance where we broke above (a lot of bullish power needed)
4H:
- Bullish
- Bullish M
- ABC pullback
*Bears are coming corrective in the leg down, bulls have more power (+)

EURCAD: Intraday Bullish Signal! 🇪🇺🇨🇦
EURCAD formed a nice bullish flag pattern on an hourly time frame.
During the NY session, the price went up and violated a resistance line
of the pattern.
The market may keep growing on Monday.
Goal - 1.482
❤️Please, support my work with like, thank you!❤️

EURCAD - Potential BearishnessEURCAD has completed its Bearish Gartley pattern and has formed divergence as well. Hence, because of multiple confluences, there is a bright chance that price will move down.
EURCAD added to my hotlistFrom my view, EURCAD should be bullish to finish filling up that daily FVG to the top...

📈 Bullish Breakout Setup on CAD Pair: Trade Idea and Analysis📈📈 Bullish Breakout Setup on CAD Pair: Trade Idea and Analysis 📈
Overview:
This analysis focuses on a potential bullish breakout pattern for a CAD currency pair on the daily timeframe. 📅 Recent price action suggests an upcoming upward movement, and this trade idea aims to take advantage of that potential. 📈
🔍 Analysis Details:
1. Current Price Action:
- The price has recently broken above a key resistance level at 1.47975, indicating strong bullish momentum. 🔺
- The current price is around 1.47975, just above the previous resistance level. 📈
2. Key Levels to Watch:
- Resistance Zone: 1.47975, which has been broken and may now act as support.
- Target Zone: The next major resistance level to watch is at 1.48851. 🎯
- Support Level: An ascending trendline supports the current upward movement, around 1.46780. 📈
3. Trade Setup:
- Entry: Consider entering a long position around the current price level (1.47975). 📈
- Stop-Loss: Place your stop-loss slightly below the broken resistance level, around 1.46780, to protect against potential pullbacks. 🚫
- Take-Profit: Target the next resistance zone at 1.48851 for your take-profit. This level provides a favorable risk-to-reward ratio. 🏆
4. Rationale:
- The recent bullish candlestick breaking above 1.47975 resistance indicates increased buying pressure. 🔺
- The overall trend has shown higher lows and higher highs, reinforcing the bullish outlook. 📈
5. Visual Guide:
- The chart highlights the resistance zone in yellow and the target zone in gray. 🟡🔳
- The white arrows depict the expected price movement towards the 1.48851 resistance level. ⬆️
- An ascending trendline provides additional support and indicates the overall bullish trend. 📈
🛠 Trade Management:
- Monitor the trade closely, especially if the price approaches the resistance levels, as this could indicate a potential reversal. 👀
- Adjust your stop-loss to breakeven once the trade moves in your favor to lock in profits and minimize risk. 🔒💰
⚠️ Disclaimer:
Trading involves significant risk and may not be suitable for all investors. Ensure you perform your own analysis and manage your risk appropriately. ⚠️

supply and demand liquidity grabafter the liquidity grab during asian session . market grab liquidities at ny session and now goaing into above supply

EURCAD | Short D1 | Market Exec |Oil Over EuroTechnical Confluences for Trade:
- Stochastics are in Overbought Conditions on D1, H4 and H1 time-frame. D1 is also entering Overbought Conditions.
- Price action is at last month's Resistance Trendline
- Price action is in a Consolidation zone
- Targeting the 38.2% Fibo retracement
Fundamental Confluences for Trade:
- ECB plans to cut interest rate next month would weaken the EUR
- Oil price should sustain with all the ongoing geopolitical risks; supporting CAD economy
Suggested Trade:
Entry @ Area of Interest 1.4760 - 1.4790
SL @ 1.4820
TP 1 @ 1.4709 (Close Half-Position & move SL to Entry level once TP1 is achieved)
TP 2 @ 1.4664
Risk-to-Reward @ Approx. 2.34 (Depending on Entry Level)
________________________________
Boosts 🚀, Follows ✌️, Shares 🙌 & Comments ✍️ are much appreciated!
If you have any ideas or charts, do share them in the 'Comments' section below and we can discuss our perspectives to improve or strengthen our strategies.
If you want something analyzed, do drop me a DM. :D
________________________________
Disclaimer: The above suggestion is an personal opinion in general and does not constitute as investment advice. Any decisions taken based on the above suggestion is purely your own risks.
Any websites / brokers / applications suggested here are also provided as informational purpose only.
________________________________

✅EUR_CAD WILL KEEP GROWING|LONG🚀
✅EUR_CAD is trading in an uptrend
And the pair was making a bearish correction
But is now about to retest a horizontal support level of 1.478
From here I am expecting the pair to go up
LONG🚀
✅Like and subscribe to never miss a new idea!✅

EUR/CAD still bullish but..EUR/CAD still bullish on internal own canal line but in 1.47820 zone has support Needs to retest that zone + clear liq 1.495-490 be patient

EURCAD Long Term Selling Trading IdeaHello Traders
In This Chart nzdcad HOURLY Forex Forecast By FOREX PLANET
today NZDCAD analysis 👆
🟢This Chart includes_ (NZDCAD market update)
🟢What is The Next Opportunity on NZDCAD Market
🟢how to Enter to the Valid Entry With Assurance Profit
This CHART is For Trader's that Want to Improve Their Technical Analysis Skills and Their Trading By Understanding How To Analyze The Market Using Multiple Timeframes and Understanding The Bigger Picture on the Charts

EURCAD: Bullish Accumulation & Breakout 🇪🇺🇨🇦
After quite an extended bullish accumulation within an ascending triangle formation,
EURCAD bounced yesterday and violated its resistance.
It opens a potential for a further bullish continuation.
Next resistance will be 1.486
❤️Please, support my work with like, thank you!❤️

DeGRAM | EURCAD has grown between the trend linesEURCAD is moving in an ascending channel between the trend lines.
The chart has successfully confirmed the dynamic resistance line four times.
The pace of movement has slowed down near the upper boundary of the channel.
We expect a pullback upon reaching the channel boundary.
-------------------
Share your opinion in the comments and support the idea with a like. Thanks for your support!

EURCAD WILL EXPLODE BUYManage SL during news time, intraday trade tp and sl mentioned not a financial advice

view on EURCAD1.EURCAD already retested from the trendline Liquidity.
2.EURCAD still on the Resistance zone and hasn't broken yet. once its broken the resistance we may take Long.
3.If EURCAD broken the support zone we may take a short after the retracement.
