USD/CAD: Strong Buy with Key Support Above Pivot PointsHello Everyone,
USD/CAD is currently a strong buy, but it's essential for the price to remain above the 1-month/1-week pivot point to see further upside potential.
TradeWithTheTrend3344
USDCAD trade ideas


USD/CAD Correction before next upward rally(6/8/2024)USD/CAD FX:USDCAD has been trapped into a curve, we can see few back and forth movements since last month. Since the NFP data was quite good, we believe the price will move another wave upward after some corrections.
If you like it then Support us by Like, Following, and Sharing.
Thanks For Reading
Team Fortuna
-RC
(Disclaimer: Published ideas and other Contents on this page are for educational purposes and do not include a financial recommendation. Trading is Risky, so before any action do your research.)

To 1.35950Usdcad has ran into resistance on the 15 min tf creating a shooting star. A move down is expected to the four hr support zone of 1.35950.

USDCAD BearishUSDCAD has formed a double top reversal pattern in the presence of divergence which indicates trend reversal.


USDCADUSDCAD
Tendency the price is under bearish pressure between 1.36895 and 1.37093
Turning level : The turning level between 1.36895 and 1.37093 so as long as the price below this level, there will be a bearish trend
resistance level : Breaking the turning level 1.37093 , the price will rise to 1.37362 as long as the price stabilize this level , there will be reach 1.37644
support level : The trading stabilizing below1.36895 the price will reach the support level of 1.35941, and under this level it will be reach 1.35611
corrective level : price will attempt between between1.36895 and 1.37093, correct itself before falling
* Know the price attempt to touch 1,37093 , the price is under downward pressure , beware today have a BOC INTEREST RATE DESCITION , will affect the market trend

Elliott Wave Analysis: Anticipating an Upward move in USDCADHello Traders,
Trust you are great.
Below is my Elliott wave analysis of USDCAD currency pair
Analysis:
The structure of the USDCAD currency pair suggests the formation of an irregular Flat corrective pattern. The initial Wave A has taken the form of a leading diagonal, moving downward.
Current State:
Wave B appears to have completed its formation. The next expected movement is the formation of Wave C.
Expectation:
An impulsive Wave C is anticipated to move upward towards the 1.37445 - 1.38147 region before a subsequent decline.
Invalidation level for the upside projection: 1.3605.
Cheers!

USDCAD Expected move Head and shoulders on USDCAD... we are expecting price to drop today and we are looking for selling opportunities

USDCAD - SELL
US Unemployment Smashed up
Return to Previous LEvel
CAD Strong
Oil has been Strong
Why price even went up apart from to collect Stops i do not know
Has Hit Resistence
Is Over Extended
Indices will Roll Over on 5 min CCPV Indicator
Tartget Order Block Below
All USD Pairs same scenario
imho

USDCAD - SELL
CAD Interest Rate Decision
Dropped by 0.25 %
Pushed up then had the BOC Conference Blah Blah talk
Then pushed back down Sharp
Target Order Block 20 pips

USDCAD WILL EXPLODE BUYTP-1-------15Pip
TP-2-------35Pip
TP-3-------Full TP
Manage SL during news time, intraday trade tp and sl mentioned not a financial advice

USDCAD ( LONG )USDCAD
Tendency the price is under bullish pressure 1.37293
Turning level : The turning level at 1.37293, so as long as the price stable below this level, there will be a bearish trend
resistance level : trade the turning level 1.37293, the price will rise to 1.37965 as long as the price stabilize this level , there will be reach 1.38387
support level : The trading stabilizing below 1.37293 , the price will reach the support level of 1.36692, and under this level it will be reach 1.36256
corrective level : price will attempt 1.37293 , correct itself before long

USDCAD is Heading Upwards After Testing major Support LevelHello Traders
In This Chart Usdcad HOURLY Forex Forecast By FOREX PLANET
today USDCAD analysis 👆
🟢This Chart includes_ (USDCAD market update)
🟢What is The Next Opportunity on USDCAD Market
🟢how to Enter to the Valid Entry With Assurance Profit
This CHART is For Trader's that Want to Improve Their Technical Analysis Skills and Their Trading By Understanding How To Analyze The Market Using Multiple Timeframes and Understanding The Bigger Picture on the Channel

USDCAD 1HI see a tendency to rise in this chart, but it should reach lower prices and then I will buy

USDCAD LONG Buying IdeaHello Traders
In This Chart Usdcad HOURLY Forex Forecast By FOREX PLANET
today USDCAD analysis 👆
🟢This Chart includes_ (USDCAD market update)
🟢What is The Next Opportunity on USDCAD Market
🟢how to Enter to the Valid Entry With Assurance Profit
This CHART is For Trader's that Want to Improve Their Technical Analysis Skills and Their Trading By Understanding How To Analyze The Market Using Multiple Timeframes and Understanding The Bigger Picture on the Channel


USDCADThis pair looks to be lining up nicely for a bullish move off of that zone. All timeframes in bullish sync and also right at that institutional level of 1.37500. Once price comes down I'm expecting price to hold support and then a few other confluences and then I will be going long. If price doesn't do these things I won't take a trade.

USD-CAD Strong Resistance Ahead! Sell!
Hello,Traders!
USD-CAD is going up
But will soon hit a
Horizontal resistance
Of 1.3782 from where
We will be expecting
A local bearish pullback
Sell!
Like, comment and subscribe to help us grow!
Check out other forecasts below too!

USD/CAD H4 | Rising into swing-high resistanceUSD/CAD is rising towards a swing-high resistance and could potentially reverse off this level to drop lower.
Sell entry is at 1.3724 which is a swing-high resistance that aligns with the 100.0% Fibonacci projection level.
Stop loss is at 1.3754 which is a level that sits above a swing-high resistance.
Take profit is at 1.3681 which is a pullback support.
High Risk Investment Warning
Trading Forex/CFDs on margin carries a high level of risk and may not be suitable for all investors. Leverage can work against you.
Stratos Markets Limited (www.fxcm.com):
CFDs are complex instruments and come with a high risk of losing money rapidly due to leverage. 68% of retail investor accounts lose money when trading CFDs with this provider. You should consider whether you understand how CFDs work and whether you can afford to take the high risk of losing your money.
Stratos Europe Ltd, previously FXCM EU Ltd (www.fxcm.com):
CFDs are complex instruments and come with a high risk of losing money rapidly due to leverage. 70% of retail investor accounts lose money when trading CFDs with this provider. You should consider whether you understand how CFDs work and whether you can afford to take the high risk of losing your money.
Stratos Trading Pty. Limited (www.fxcm.com):
Trading FX/CFDs carries significant risks. FXCM AU (AFSL 309763), please read the Financial Services Guide, Product Disclosure Statement, Target Market Determination and Terms of Business at www.fxcm.com
Stratos Global LLC (www.fxcm.com):
Losses can exceed deposits.
Please be advised that the information presented on TradingView is provided to FXCM (‘Company’, ‘we’) by a third-party provider (‘TFA Global Pte Ltd’). Please be reminded that you are solely responsible for the trading decisions on your account. There is a very high degree of risk involved in trading. Any information and/or content is intended entirely for research, educational and informational purposes only and does not constitute investment or consultation advice or investment strategy. The information is not tailored to the investment needs of any specific person and therefore does not involve a consideration of any of the investment objectives, financial situation or needs of any viewer that may receive it. Kindly also note that past performance is not a reliable indicator of future results. Actual results may differ materially from those anticipated in forward-looking or past performance statements. We assume no liability as to the accuracy or completeness of any of the information and/or content provided herein and the Company cannot be held responsible for any omission, mistake nor for any loss or damage including without limitation to any loss of profit which may arise from reliance on any information supplied by TFA Global Pte Ltd.
The speaker(s) is neither an employee, agent nor representative of FXCM and is therefore acting independently. The opinions given are their own, constitute general market commentary, and do not constitute the opinion or advice of FXCM or any form of personal or investment advice. FXCM neither endorses nor guarantees offerings of third-party speakers, nor is FXCM responsible for the content, veracity or opinions of third-party speakers, presenters or participants.

Big buy incoming for USDCADLooking at the weekly TF down to the daily TF..USDCAD looks bullish and the bulls are looking to clear some liquidity at the upside ...
So I expected a sell down to the 1.3600 region , before the bulls begin the journey to clear the liquidity parked up above all the way to 1.3900 and probably touch 1.400

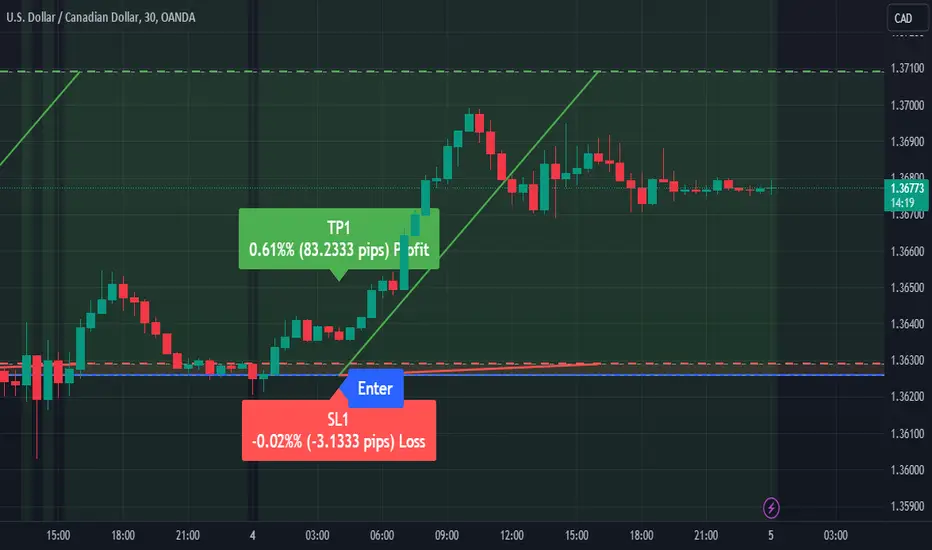
Trading Alert: USDCAD Buy SignalDirection: Buy
Enter Price: 1.36258
Take Profit: 1.37090333
Stop Loss: 1.36289333
Justification:
The prediction for the USDCAD currency pair to move upward is based on a combination of market analysis and algorithmic insight provided by the EASY Quantum Ai strategy. Several factors have contributed to determining this Buy signal:
1. Market Sentiment: Current market sentiment indicators reveal a bullish trend for the USD against the CAD, influenced by stronger economic data from the US.
2. Technical Indicators: Key technical indicators such as Moving Averages, RSI, and MACD demonstrate a potential upward momentum. The price action is showing positive divergence, suggesting a forthcoming rally.
3. Fundamental Analysis: Recent developments and favorable economic reports from the US are likely to support USD strength. Conversely, slower economic growth forecasts for Canada may weaken the CAD.
4. Quantitative Analysis: The EASY Quantum Ai model has analyzed historical data patterns and predicts a probable upward movement.
By entering the market at 1.36258 and setting the Take Profit at 1.37090333, the strategy aims to capitalize on the expected bullish movement. The Stop Loss at 1.36289333 is placed to manage risk effectively.
This forecast is based on insights and advanced algorithms from EASY Quantum Ai, blending technical, fundamental, and quantitative analyses for a comprehensive trading decision.
USDCAD | Hidden Bullish Divergence | AB=CDThe USDCAD chart has currently formed a Harmonic AB=CD Pattern, which indicates a Potential Reversal Zone (PRZ). Additionally, there is a Hidden Bullish Divergence on the 1-hour time frame, suggesting that the current downtrend is about to shift into an uptrend. Furthermore, the price has mitigated the Order Block (OB) and is now moving upwards. These confirmations indicate a short-term bullish momentum, although the overall structure on the higher time frame remains bearish.
In summary:
1: Harmonic AB=CD Pattern: This pattern suggests a potential reversal zone (PRZ).
2: Hidden Bullish Divergence: Observed on the 1-hour time frame, this indicates a potential shift from a downtrend to an uptrend.
3: Order Block (OB): The price has mitigated the OB and is moving upwards, supporting the short-term bullish momentum.
4: Higher Time Frame Structure: Despite the short-term bullish signals, the overall structure on higher time frames remains bearish.
It's important to consider these factors together and conduct thorough analysis before making any trading decisions.
