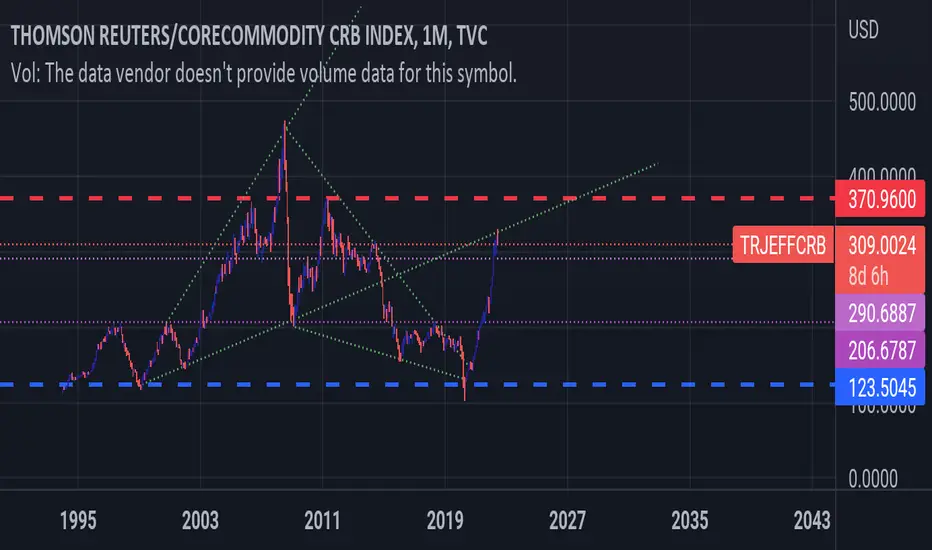
For pure charting enthusiasts.
This is a beautiful chart. When we filter time out of the analysis, the price action becomes clearer.
TRJEFFCRB trade ideas

Commodities on the rise, but can they pull back?Commodities have been in a bull run since 2020, within an uptrend that can resume after the pullback observed in 2022. Analyzing the CRB Commodity Index, I believe that the pullback from that recent 2022 high isn’t over yet. There’s potential for a C wave that could retrace to 38.2% of the 2020 bull run. This may suggests that inflation might cool down, but much depends on the Federal Reserve’s rate decisions. Premature rate cuts could spur demand and drive prices higher, complicating the inflation scenario.

Commodity bull runCommodities are awakening from their slumber which is sparking renewed global inflation fears. Due to escalating global tensions, crude oil has surged more than 10% since the start of March which has seen the price per barrel close above $90 per barrel last week. Precious metals along with industrial metals have also benefitted from the rise in oil prices which has seen the Reuters Core Commodity index climb to a 6-month high. As mentioned previously, the Federal Reserve’s (Fed) fight against inflation is essentially its fight against oil and this recent break-out in commodity prices has poured some cold water on the expectations that the Fed will start cutting rates as soon as June this year.
The index will test the resistance level of 300, the 61.8% Fibo retracement, soon and a break above this level will allow the current commodity bull to race towards the 2022 high of 330.

Inflation ratios for spotting fed rate trend .... Inflation ratios for spotting fed interest rate short-term trend ....

CRB index Are commodities bullish, bearish, or going sideways? Big picture, long term still feels bullish...


$spy $tly $dba Commodities are building a baseI dare the fed to start cutting rates. M2 is also turning up. Another sign of economic strength returning. What reason is there for cutting rates other than 34T ind gov't debt

INFLATION IS NOT DEAD YET The chart posted is that of the CRB index The basket of ALL things . Iam looking for the High for the year in the stock market to form this jan 11 to the 18 and the Low for the CRB this should push the 10 yr into the last drop from 3.76 to 3.81 and then the TROUBLE

A bright future ahead for commoditiesFunction: Corrective
Wave Family: Simple Zig-Zag
Macro count: 2 of 5 of 5
Invalidation points: Below 0.79 of Primary 1
Description: TRJEFFCRB is pulling back in three waves to find support at the terminus of primary (2) before taking off in primary (3). Expecting C to be 100% of A at ~230 near the base of the channel.

Bullish pullbackNice bullish pullback on CRB core commodities index after hitting resistance on the 38.2% Fibo retracement level of 283.
Golden cross is also imminent (50-day crossing 200-day MA).
A break below the 23.6% Fibo level of 272 will however invalidate the idea.
Fundamentally however, the weak data and economic growth from China is negative for commodities.

So… how’s that deflation narrative looking?We’ve become so accustomed to headlines of ‘peak inflation’ and falling input prices that some have been throwing the wonderful ‘deflation’ word around. And we think most would enjoy a bit of deflation, as that would result in lower interest rates. However, with commodity prices (particularly oil) being a key driver of inflation, a lot of the softness can be tied back to the underperformance of commodities over the past 12 months. Supply chain disruptions have also been in the rear-view mirror and no longer a concern (or are they?)
Over 30,000 UPS workers are vowing to strike if a new pay deal is not negotiated by 1 August, which should throw a nice spanner in the works of the US (and global) parcel delivery system. Russia has pulled out of a key grain deal and is bombing Ukraine ports to derail trade in the Black Sea. And India has banned rice exports (apart from Basmati) to fight domestic inflation, adding to fears of another round of food inflation.
It is therefore worth noting that the Thomson Reuters CRB commodities index is seemingly breaking out of a 12-month retracement on the monthly chart. Furthermore, the retracement lasted 11 months before June’s small bullish candle, so the broad commodities index may have bottomed in May at -19.8% y/y. And assuming this is the breakout of a falling wedge, it projects a target around the 329.60 high. But if it were deemed a bull flag, the target sits around 365.
And what do we think will happen to consumer prices further down the track? Of course, they will begin to rise again. And the worrying fact is that inflation tends to come and go in waves, so if commodities continue to rally then it looks like the next wave of rising y/y inflation is pending.

CRB Inflation tracker Inflation Y/Y almost seems to track the CRB index to the point of disbelief, especially in terms of putting in highs and lows. And CRB looks to have made a decent X wave pullback to golden fib which marks decent tops. Consequently, it does seem like inflation has topped and the economy can fall into deflation. Also, May prices have fallen further and hence should likely give neutral CPI solidifying the belief that Fed will pause rates in the coming FOMC. If that's the case, then there is a real possibility of an extended rally and maybe even new ATHs.
RIP stagflation narrative.

US Inflation is to fall following the fall of CRB IndexTRJEFFCRB almost confirms the Downtrend which indicates the US Inflation is about to ease down.
Meanwhile, as inflation falls, the rise of Fed Fund Rate should also near its ends.

Inflation has peakedNow that everyone is talking about inflation it’s over! It’s going for be a quite interesting time when everything begins or continues to deflate into the abyss. Watch the federal reserve over compensate for inflation and cause a recession we have not seen the likes of.

The Fed won't be able to get inflation back to 2%The Fed says they are trying hard to get inflation down however the commodities chart is sticking out it's tongue at the Fed.
Everyone on social media is screaming: The Fed is going to cause a major RECESSION; MAJOR RECESSION IS COMING!!!
Yet this chart is not screaming a major recession is coming (nor is it at all scared by the Central Banks "hawkish" talk)?
Let's look at past recessions (notated by the vertical red lines):
July 2008-Notice how commodities plummeted after the high was made...literally just straight down due to the nature of the recession. (During the recession commodities dropped about 57%)
March 2020-Commodities started to plummet in Jan 2020 and then plummeted hard during the short lived recession. (During the recession commodities dropped about 40%)
April 2001-Commodities started to weaken after double topping in 2000 but didn't come down too much during the recession. (During the recession commodities dropped about 27%)
What does this analysis tell me?
1. That we are not on the brink of a severe recession (like 2008). At this point; commodities are just in correction mode.
2. During a recession commodities plummet along with all the Indexes. Therefore, if this chart plummets so will just about every other chart.
4. We have a double breakout in commodities from the LT downtrend line & the LT horizontal trend line...any good pullbacks in commodities will be met with buyers hence inflation is NOT transitory and will remain sticky.
5. The soft landing narrative is a farce because you cannot get commodities to plummet unless you cause some sort of recession.
6. Commodities are saying the FED is actually not being hawkish enough.
7. The reason for inflation is very simple: money flowed into commodities. It all starts with raw materials.
So are the Central Banks around the world really trying to get inflation under control? Or are they just "talking the talk"?
At this point, the only way to get inflation down to 2% would be to cause a major recession but the rate hikes thus far have NOT scared the commodity chart into submission therefore Powell and all the other central bankers around the world are actually not doing enough at this point.
So.....Stagflation continues!
(BTW...the bond market has spoken: Cheap debt won't be making a comeback anytime soon!)

Has Inflation Peaked?An unpopular opinion I have is that inflation has already peaked. Just as the Fed took too long to raise interest rates. They now appear to be raising the Federal Funds rates too high in their attempts to mitigate runaway inflation.
For being such an unpopular opinion - it is oddly evident almost anywhere you care to look:
Freight Rates have dropped 8.2% y/y www.dat.com
The largest drop on the ISM Manufacturing PMI Report is in prices (Aug 52.5 vs Jul 60 -7.5% Change ) www.ismworld.org
Oil - opened the year at $76 Annual % Change currently 4.69%! (USOIL Currently Trading at $79.30)
Gold - Treasuries are an easy swap with these yields... US02Y - 4.212% !
NAHB Housing Index Down Sharply blog.itreconomics.com
Unemployment has been resilient despite the steep drop in growth. However, the Fed plans on mitigating inflation through increasing unemployment. 'Beyond maximum employment' is pinkies up speech for - 'we are coming for your job'. One way to slash demand is for folks to lose their employment eh?
Soft Landing is months old talking points now as Jerome Powell states 'The sacrifice is slower growth in the future' .
For being so powerful & influential it is shocking to realize how poorly the Fed is keeping a pulse on inflation. I suspect the worse of inflation is behind us, and over the next three months we may see inflation back under the 5% level.
When it comes to inflation remember the formula: MV=PQ
M stands for money.
V stands for the velocity of money (or the rate at which people spend money).
P stands for the general price level.
Q stands for the quantity of goods and services produced.
Based on this equation, holding the money velocity constant, if the money supply (M) increases at a faster rate than real economic output (Q), the price level (P) must increase to make up the difference. Velocity has remained constant to now offset the increase in money supply and even lead to deflation instead of inflation.
This is coupled with demand dropping as supply shocks have now been better absorbed.
When the market beings to price in a pause in the Federal Funds Rate - this could be a catalysts for buying the bottom in risk assets such as equites & crypto.
In all this volatility! Trade safe mates!

still no sign of bullish signal on COmmodity and oilit proves the dollar still bullish
maybe we need to wait for the 2 November 2022 FOMC 75 bps rate hike...

CRB Commodity index Elliott wave projectionProjection based on Elliott wave analysis.
This outlook is for the 12-24 months ahead

CRB Index ending Diagonal - is the commodity cycle done ? CRB Index has been trending steadily since the time the logistics issues cropped up along the Covid wave across countries , gaining additional impetus from the crude oil rally - ukraine war. However off late its a bit surprising that so many of the commodity shortage or panic demand factors are so quickly priced in , as the ending diagonal in CRB almost makes it certain by way of wave theory that a significant top is placed. This also shows the tendency to stay out of commodities as the central banks who have suddenly woken up to inflation - rather late are now not leaving any scope to increase rates.

Peak in CRB leads to good inflation conditionMore percentages to oil that is good for supply problems so we can have growth in the economy .US must lead economy cool down that's a good sign for world economy recovery
commodities bearish trend signal, let oil drop to 80$!!!!let oil drop to 85$ or 80$
it will reset the indicator on oil and make it ready to bullish above 160$ on winter season end of year 2022
BS Europe and other countries can get away from Russian oil and gas
take a lot of money and 3 years to build new oil distribution from other country

Market Update June 6 2022 Keep It SimpleI will say it again. Caution in all asset classes remains. How much risk are you taking on for how much reward you are expecting to acquire?
Keep asking yourself that question. Better to be out of the market wishing you were in rather than being in the market wishing you were out.
Not enough time to finish sorry :(

Commodities trajectoryPeople are putting in Bids to rent apartments in major cities, fewer and fewer people are buying homes, CPI is going up.
The result is the value of the dollar (and for contemporary living) is going up.
This results in high commodity prices to match the inflation, and the rise has been unreal. It will likely continue this year - I believe a double top will take place.
Countries need to address the CPI.
People will buy less supplies and spend less in general -- this will briefly increase commodity prices as the supply still limited. but soon, prices will fall as there will be insufficient demand (in light of people spending less, their valuable dollars).
As such, commodities will likely finish a double top and then stabilize as the economy recovers starting 2023
