Alahli Bank to all time high as you see in the chart everything is clear
i hoop to activate the SL NO jokes with STOP LOSE
we will change the SL soon when we get some confirmation in the chart.
GOOD LUCK & TRADE SAFELY
1180 trade ideas

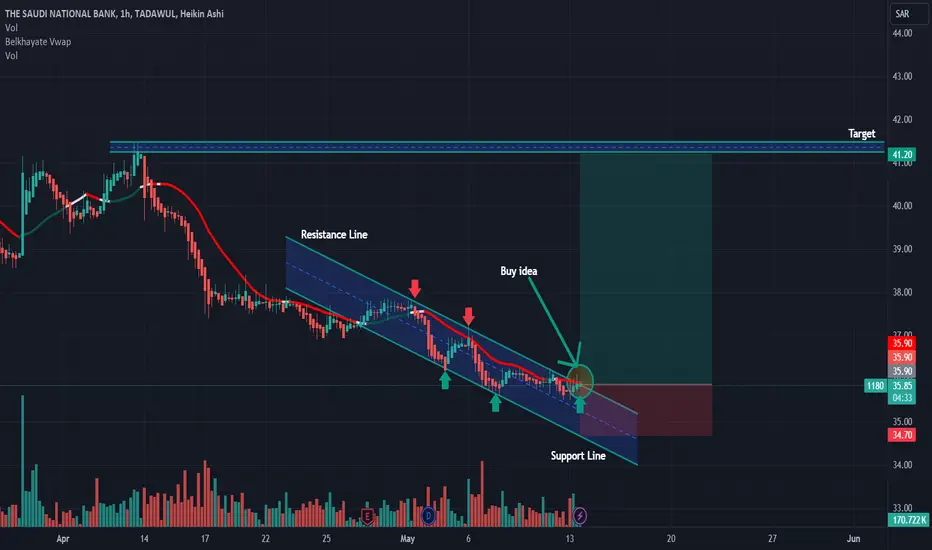
1180: Buy ideaOn 1180 as you see on the chart we will have a big probability to have an uptrend if only if we have the breakout with force the vwap and the resistance line by a big green candle follow by a large green volume.Thanks!
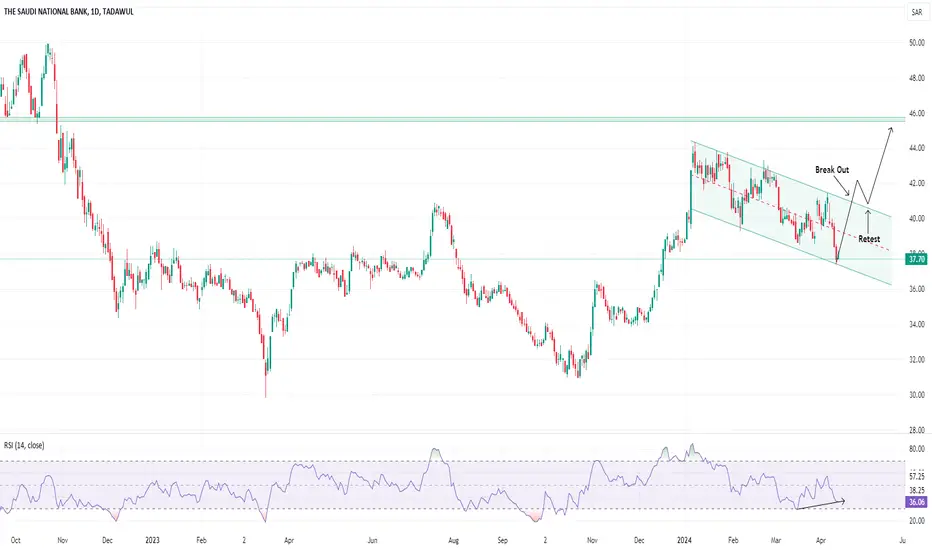
1180 | Flag Pattern & Bullish DivergenceSaudi National Bank displays a promising bullish reversal pattern characterized by the formation of bullish flag pattern and divergence with RSI. Our plan entails accumulating the stock within the designated buy zone (37.50-37.70 range), while setting stop loss orders below the bottom of support around 36. Anticipation builds for a substantial surge in momentum upon the test of the trend line, anticipated around the 40.90 area. To guide our trading decisions, we've delineated two distinct targets: an immediate target around 40.90 and a final target for exiting the trade will be around 45.50 depending upon break out.
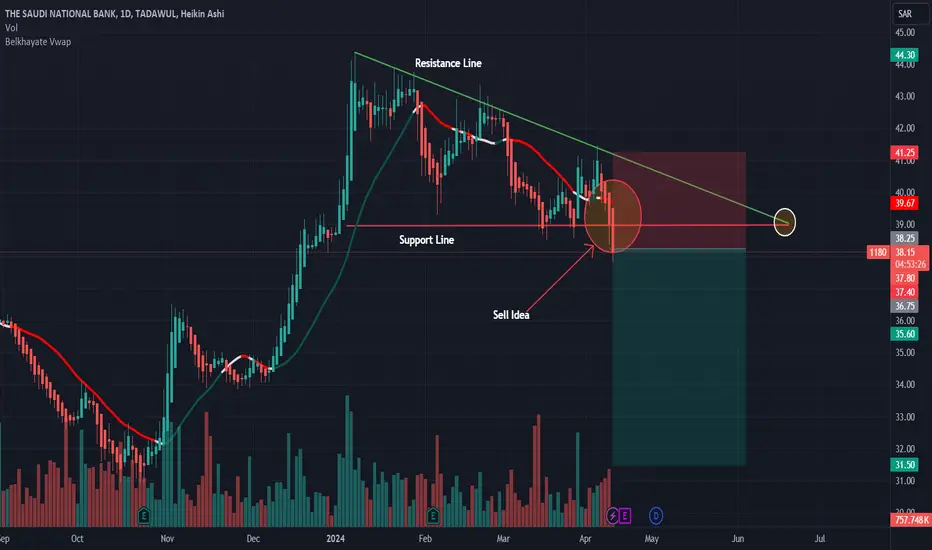
1180: Sell ideaSell idea on 1180 as you see on the chart because we have the breakout with force the vwap indicator and also the breakout with force the support line.Thanks!
#NSB_1180I expect, and God knows best, that it will be a model of the Wolfe wave as shown in the drawing, and I do not bear responsibility for anyone’s purchase.

The Saudi national bank The stock price now stands at important resistance level. What I can see is the tread is upward and the money still in. For me 48 is a just a matter of time.
Dr SAUD

1180, Saudi National BankSaudi National Bank, 1180
Symmetrical triangle
Levels to watch for:
R: 42.80
S:39.05
Next target 44.25 then 45.40
Good luck!


40% upside potential in The Saudi National BnakThe Saudi National Bank is the largest commercial bank in Saudi Arabia.
The share of the bank saw a rise in the form of a wave 1 in march of 2023 from the bottom and then a subsequent 80% retracement of the same from July till oct 2023.
The share has now kicked off in the new wave 3 structure. Since the wave 2 retracement was very deep, it opens up the probability of wave three getting extended and move all the way up till the 50 SAR mark.(44% from CMP)
One could look for some retracement of the past 4days move to make an entry and then ride the strong bullish wave 3 all the way it it lasts.
Note*- This post of is for educational purpose only.

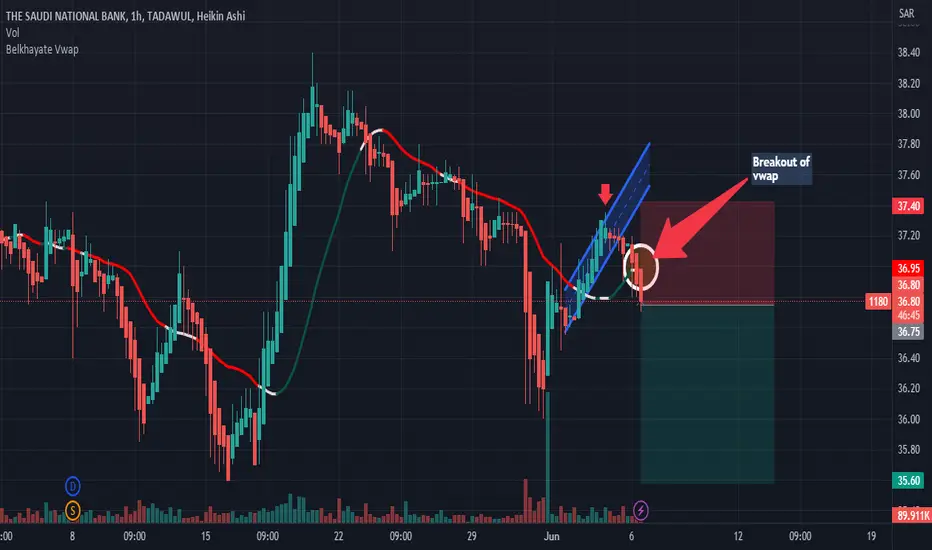
1180: Buy ideaWe will have a big probability to have an uptrend on 1180 as you see on the chart because we have the breakout with force the vwap indicator and the resistance line by a big green candle with a large green volume. Thanks!

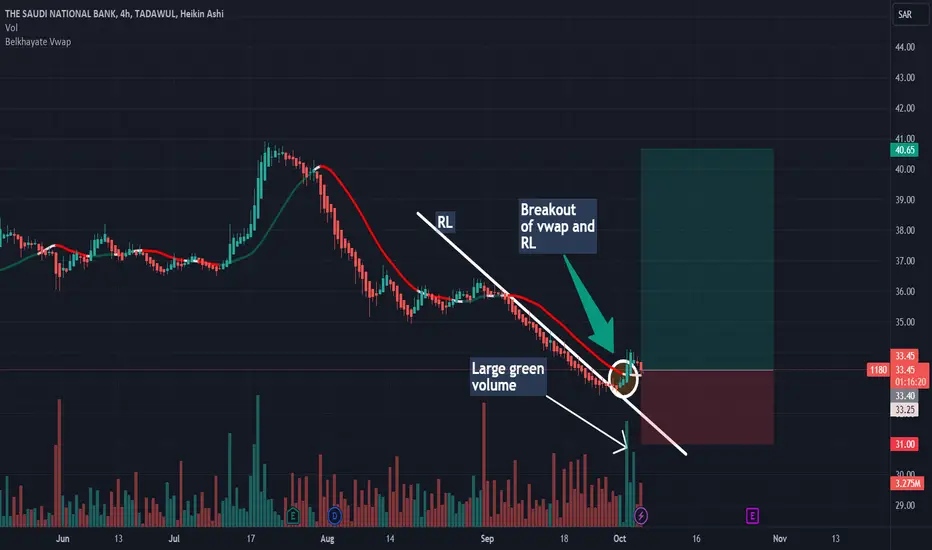
1180: Big probability of an uptrendOn 1180 as you see on the chart we have the breakout of vwap and the resistance line so it's mean that we will have a hight probability to have an uptrend. Thanks.
1180 buy the saudia national bank 1180Buy the stock is a good idea around this area with a target around the resistance shown in the graph

SNBBullish setup build up in SNB.
The price has formed a bullish flag pattern. This is a bullish continuation pattern, which suggests that the price is likely to continue to rise after it breaks out of the flag.


1180 THE SAUDI NATIONAL BANK Bullish Trend1180: THE SAUDI NATIONAL BANK in in Bullish Trend by Making a series of HHs & HLs


1180: Sell ideaOn 1180 we will have a big probability to have a downtrend because as you see on the chart we have the breakout of the vwap indicator by the sellers.Thanks!
1180 SAUDI NATIONAL BANK (SNB)Nobody Knows Where is Price Going.
Hey traders, here is the analysi.
If you guys like my analysis please hit like👍 and follow.
Thanks.
DISCLAIMER- This is not financial advice.
SMART MONEY CONCEPT.
identify Liquidity Or Become Liquidity

Could we assume earning will be OK based on this chart of 1180?I do like The Saudi National Bank (SNB) chart. Seems interesting and bullish to me. However, earnings are coming soon which might give a good opportunities to buy long-term.

1180: Buy ideaOn 1180 we have a buy idea after the breakout of vwap indicator as you see on the chart.Thanks!

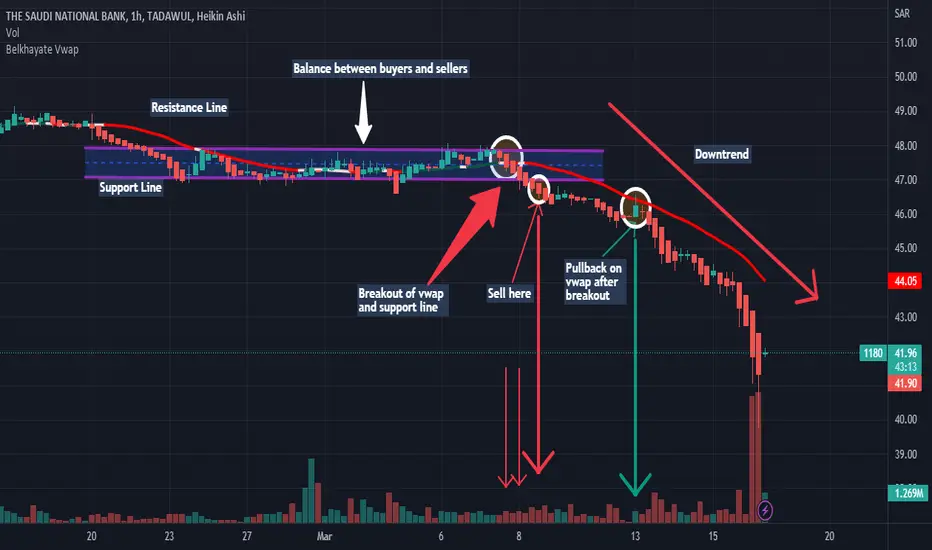
1180: Analysis: Sell ideaOn 1180 as you see on the chart we are in a balance situation between buyers and sellers and also we have the breakout of the vwap and the support line by the sellers so it's mean that we will have a big probability to have a downtrend.Thanks!
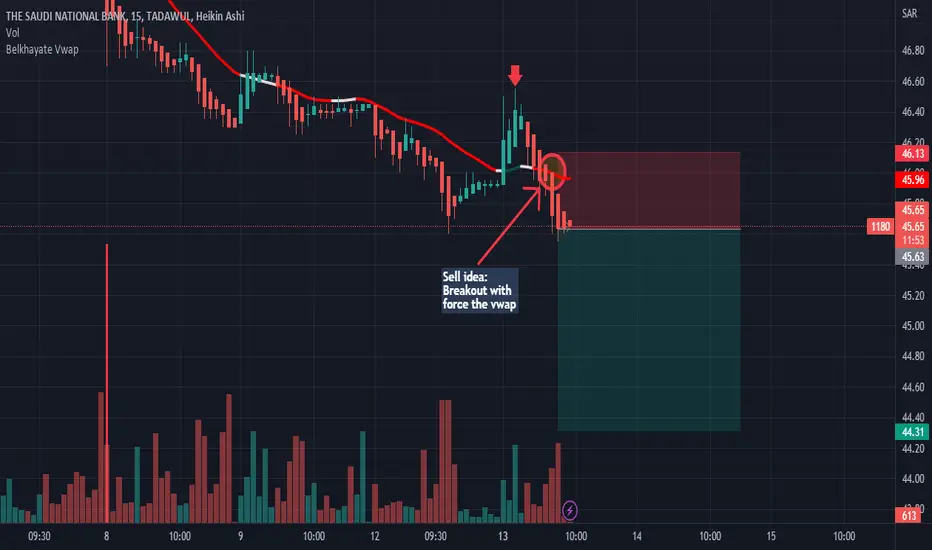
1180: Sell ideaAs you see on the chart we have a sell idea because we have the breakout with force the vwap by a big red candle with a large red volume.Thanks!
1180: Sell ideaAs you see on the chart we have a pullback on vwap so it's mean that we will have a big probability to have a downtrend.Thanks!
