PSO:PSX Buy CallPSO printed a Bullish Divergence with a Falling wedge pattern suggesting a Bullish shift in momentum.
Market entry is suggested with Stop Loss on previous Lower Low. Take profit levels are recommended on 1:2 Risk Reward Ratio.
Happy Trading!
PSO trade ideas

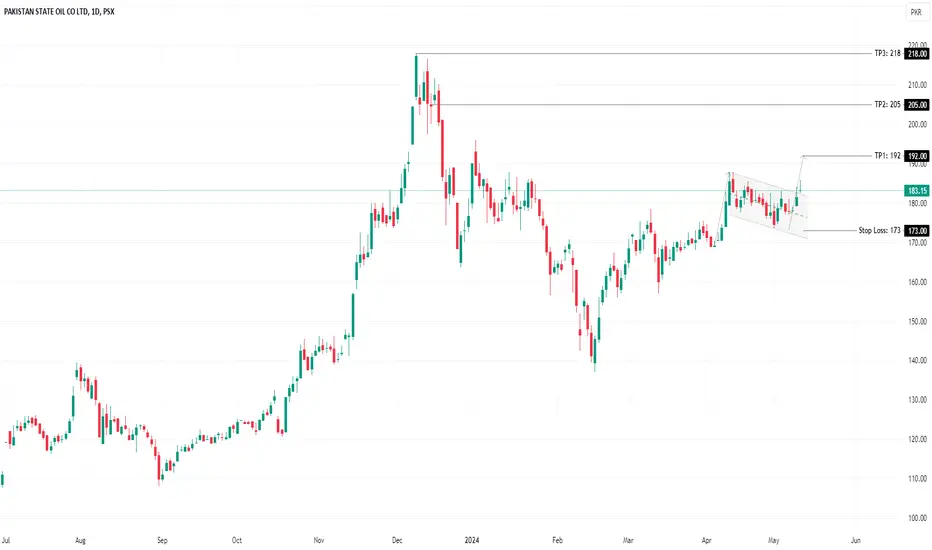
PSO | Flag Pattern🚀 Stock Alert: PSO
📈 Investment View: Technically Bullish 📈
🔍 Quick Info:
📈 Buying Range : 183-184
🎯 First Target : 192
🎯 Second Target : 205
🎯 Third Target : 218
⚠ Stop Loss: 173
⏳ Nature of Trade: Mid Term
📉 Risk Level: Medium
☪ Shariah Compliant: YES
💰 Dividend Paying: YES
📰 Technical View: PSO displays a promising bullish pattern characterized by the formation of flag pattern. Our plan entails accumulating the stock within the designated buy zone (183-184 range), while setting stop loss orders below the bottom of flag at 173 to manage risk effectively. Anticipation builds for a substantial surge in momentum upon the completion of flag around the 192 area. To guide our trading decisions, we've delineated two more distinct targets: an intermediate target around 205 and a final target for exiting the trade will be around 218 which acts as a major resistance level.
PSO - BAT PATTERNAfter a bearish trend, PSO has reversed its trend , there is a divergence on RSI too and a good bullish move is expected. Long entry recommended.

PSO - KSE100- Possible set up.PSO is currently in the Fibonacci golden pocket and above the support level of the previous high. If the price breaks out above 185.70, it can test the 200 level and then 213. If the price breaks down to 174, then it might retest the 145-150 level.

PSO: Bearish Trend ShiftPSO:PSX printed a rising wedge pattern followed by a bearish divergence suggesting a Bearish Shift. Shorting is recommended as per the levels mentioned in the chart.

PSO - 1H - Bullish flag - PSXIn this chart we have observe a Bullish flag on a 1 hour time frame. and we placed entry, tp & sl points accordingly. No Divergence spotted


PSO - A bearish TrendPSO has recently changed into bearish trend by making lower low and lower high. Lets see how it unfolds.

PSO- BULLISHPSO looks bullish and currently in uptrend, makes its first higher high and now completing higher low.

PSO FALLING WEDGE (BULLISH CONTINUATION)PSO - Trading in a post-breakout continuation. watch out the rectangle BO zone.
Targeting: 200+

PSO is BullishPSO has made a bullish divergence, and has also printed a higher low, it is currently defining a higher high, which would confirm a bullish rally, taking the price to new highs. Targets are mentioned on the chart. According to AB = CD harmonics projections too, the price could cross 250.

PSO🚀 Stock Alert: *PSO*
📈 Investment View: Technically Bullish 📈
🔍 Quick Info:
📈 First Entry : 142 - 142.20
🎯 Target : 163
⚠ Stop Loss: 130
⏳ Nature of Trade: Mid Term
📉 Risk Level: Medium
☪ Shariah Compliant: YES
💰 Dividend Paying: YES

PSOThe price of the stock has been in a strong uptrend since the middle of 2023. The price has more than doubled from its low of around 110 in July 2023 to its current price of around 217. The volume has also been increasing, which suggests that there is strong buying interest in the stock.
Pull back seemed at the test of 50% Fib retracement and currently trading above 38.2% which indicate that the price can test its previous resistance of 217 which can consider the first target. Moreover, if price breaks above and sustains then next resistance lied around 247. On the flip side, place stop loss below 160 after the break of previous low which indicates trend reversal in the price.
Here are some of the technical indicators that you can use to analyze the stock:
The Relative Strength Index (RSI) is a momentum indicator that measures the magnitude of recent price changes. The RSI is currently above 61. However, the RSI can stay above 70 for extended periods of time when a stock is in a strong uptrend.
MACD is a trend-following indicator that measures the difference between two moving averages. The MACD is currently above its signal line, which suggests that the uptrend is still intact.
Overall, the technical indicators suggest that the stock is in a strong uptrend. However, it is important to remember that technical analysis is not a perfect science and past performance is not necessarily indicative of future results.

Important Support Level143 - 144 is a Very Important Support Level that
should be sustained for Upside
However, if 143 is broken, 129 may also act as a
Strong Support (must check candles formation at
this level before Entering here)
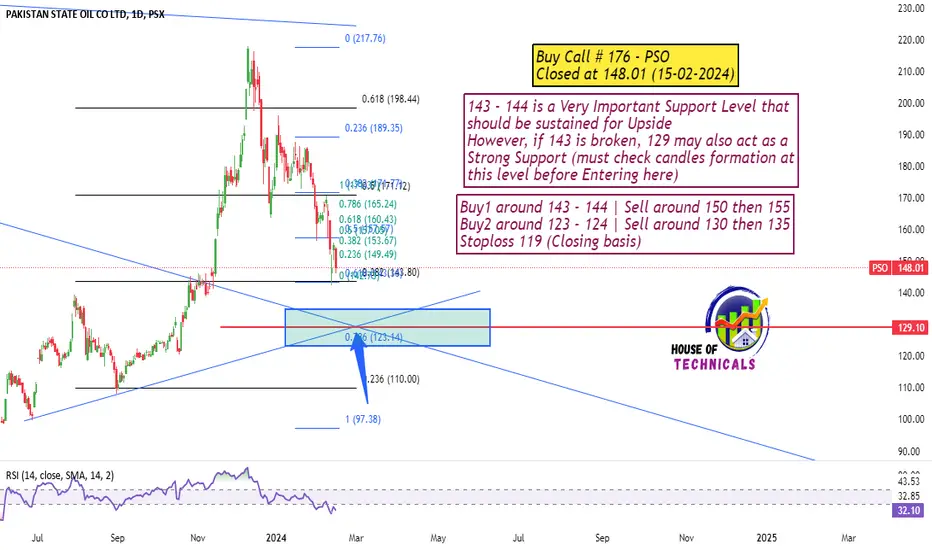
PSOBuy1 around 179 - 180
Buy2 around 176 - 176.50
Sell around 183 then 186
Stoploss 173 (Closing Basis)


PSO IN BULLISH TRENDBULLISH INDICATION:
.Prize was moved in PRZ zone.
.DIVERGENCE already formed in RSI
.BULLISH COUNTER ATTACK formed on PRZ zone
.THREE WHITE SOLDIERS formed.

PSO - KSE100 - Possible setup.PSO at its weekly resistance, wait for pull back to open long position.


PSOAs highlighted before, PSO is targeting towards 196.50, was recommended when it was at 169 after the breakout of the descending trend line. For new entries it can be bought at current price of 183 - 184 for the target of 196.50. If this level breaks then second and third targets are 200 and 220 respectively.

PSOPSO is presently testing its resistance level of 123.60, and there is a higher likelihood of its facing rejection at this point. It would be prudent to consider potential entry or support around the 115.45 support level instead with the stop loss below 112.

PSO head and shoulder formed. Going short & entry again on PRZPSO already formed a head and shoulder. I have been tracing this for a while. Hence going short and then will do a reversal trade. This trade I anticipated the moment head formation was completing and the right shoulder started forming. Hence went short. Now based on the projection derived from the top of the head to the neckline, a potential reversal zone should be forming around an area where a previously low is present making a candidate for double bottom. I will evaluate the bullish divergence around double bottom and based on the divergence and confirmation of the HH and HL, I will go long. At the moment waiting patiently and anticipating the formation of the double bottom. Additionally I can short the stock until the PRZ as well. Hence I will post a second link for the same setup.

PSO head and shoulder pattern with PRZ around double bottomPSO already formed a head and shoulder. I have been tracing this for a while. Hence going short and then will do a reversal trade. This trade I anticipated the moment head formation was completing and the right shoulder started forming. Hence went short. Now based on the projection derived from the top of the head to the neckline, a potential reversal zone should be forming around an area where a previously low is present making a candidate for double bottom. I will evaluate the bullish divergence around double bottom and based on the divergence and confirmation of the HH and HL, I will go long. At the moment waiting patiently and anticipating the formation of the double bottom. Additionally I can short the stock until the PRZ as well. Hence I will post a second link for the same setup.
