Crude**CrudeOil:**
This week's forecast is for the price to fall to the bottom of the channel and reverse to the top of the channel.
CLM2024 trade ideas

2024-06-03 - a daily price action after hour update - oilGood Evening and I hope you are well.
wti crude oil
comment: In my weekly outlook I was bullish for 80 again, unless bears produced strong momentum below 76 and that was basically just on trading hour today where sold off for 232 ticks. 75 was the price I was talking about for weeks now and bears had a strong bear day down to 74. Depending on how you draw the bull trend line from the weekly/monthly chart starting in 2021-08, we are close enough or right on it. I do think bears surprised enough today to get another leg down because they clearly broke below the bear channel from last week. 72 is an obvious next target or the 2023 close at 71.6.
current market cycle: Bear trend
key levels: 70-77
bull case: The best the bulls can hope for is sideways movement and maybe a retest of the lower bear channel line around 74.5. Every touch of the 1h 20ema is violently sold and until that changes, bulls have no arguments on their side. They need to keep it above 74 or we will probably see 72 fast.
Invalid below 74
bear case: Bears did enough damage today to make bulls very cautious. Breaks below a bear channel with accelerated selling are not that common so it’s a strong breakout. No one knows where most algo’s draw the big bull trend line so we will probably find out over the next days. Right now it’s waiting for a pull-back to maybe the 15m or 1h 20ema where we wait for confirmation of another leg down. I got measured move targets between 70 and 72.
short term: Sideways to down - I wait for a pull-back or another strong momentum sell
medium-long term: We are seeing the big triangle playing out between 73 and 86 (could also be 87 but for now I see the spike above 83 as a failed breakout of the triangle. We hit the lower trend line and now we will test back up to above 83. —will update this tomorrow or Wednesday
trade of the day: Selling while the bar 10 was forming. I told my room to sell at 15:39 and we were short from 75.92 for +90 and immediately after another short on the bounce for +50.

Thursday Forecast Crude!So my target for this week will be the weekly open.
Simple as that sounds we do have some bsl above however Im expecting price to deliver BEARish as per HTF and the rejection for the Daily FVG
Be aware that trading is light we are in the last couple of days of the Month.

CL - 8 Hrly - Weekly Forecast - 03 June 2024This is my weekly forecast of Oil for the week of 03 June 2024
We have closed below a key support level on the Monthly, so I now see this as bearish.
Looking to short at the daily inefficiency (FVG) for targets below liquidity lows.

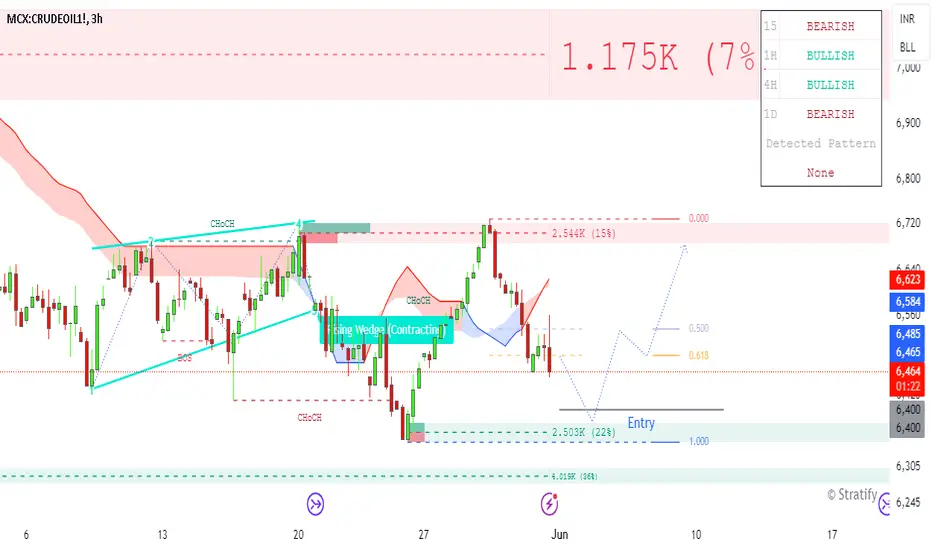
CRUDEOIL Buy Setup 3 hrs TGT with in a 3 daysSuper valid-looking! Leave a comment if you like my entry setup. This share is for educational learning purposes only, and I am not responsible for your profit or loss. Note: For more details, check the chart."
Can the HOUSE CAPITALIZE Long above $80.00 Per Barrel...?NYMEX:CL1!
"If you train hard, you'll not only be hard, you'll be hard to beat." -Herschel Walker
Oil has been struggling to Break above $80.00 Per Barrel roughly this whole month of MAY and this week we could actually see buyers gain strength and get over the hump... However that is a long shot prediction! Now if this actually does come to pass then this is what I'll need to see in order to go LONG...
1) Price is currently trading around a 4Hr Supply Zone. ** I want to see buyers push price up N break the supply zone and continue towards the HTF S&R Zone....
2) We have a HTF Descending eR/LQ Trendline that I want to Buyers Breakout N push towards $80.00 Per Barrel... I would like to see a retest of the Failed 4Hr Supply Zone and eR/LQ trendline for buyers to gain more strength for pushing towards our target...
3) Now if we can get the sequence of events to take place that I stated above, Then we will wait for the break above $80.00 Per barrel with confirmed candle closures above price and above the S&R Zone... I want to see confirmed candle closures on the 30m TF N Below to establish conviction in the move from buyers to enter LONG....
4) Now if we can get the Break above $80.00 Per barrel with confirmed candle closures above price and above the S&R Zone then I'll Enter LONG and Target the break of the 4Hr Supply Zone price ($81.10 Per Barrel) 110 pts to be exact in our favor... Ill set my stop just below the S&R Zone EQ Level giving me roughly around a 2.7RR....
Remember when it comes to FRM (Financial Risk Management) our job is to manage the downside costs of printing High side returns of $$$ consistently... Let's Step!!
Stay Focused & Reach Excellence!!
#BHM500K #NewERA #Champions

Crude Oil continue with the Uptrend On Crude Oil, it's nice to see a strong buying reaction at the price of 79.85 .
There's a significant accumulation of contracts in this area, indicating strong buyer interest. I believe that buyers who entered at this level will defend their long positions. If the price returns to this area, strong buyers will likely push the market up again.
Strong uptrend and high volume cluster are the main reasons for my decision to go long on this trade.
Happy trading
Dale

Can the HOUSE CAPITALIZE Long above $80.00 Per Barrel...?NYMEX:CL1!
"If you train hard, you'll not only be hard, you'll be hard to beat." -Herschel Walker
Oil has been struggling to Break above $80.00 Per Barrel roughly this whole month of MAY and this week we could actually see buyers gain strength and get over the hump... However that is a long shot prediction! Now if this actually does come to pass then this is what I'll need to see in order to go LONG...
1) Price is currently trading around a 4Hr Supply Zone. ** I want to see buyers push price up N break the supply zone and continue towards the HTF S&R Zone....
2) We have a HTF Descending eR/LQ Trendline that I want to Buyers Breakout N push towards $80.00 Per Barrel... I would like to see a retest of the Failed 4Hr Supply Zone and eR/LQ trendline for buyers to gain more strength for pushing towards our target...
3) Now if we can get the sequence of events to take place that I stated above, Then we will wait for the break above $80.00 Per barrel with confirmed candle closures above price and above the S&R Zone... I want to see confirmed candle closures on the 30m TF N Below to establish conviction in the move from buyers to enter LONG....
4) Now if we can get the Break above $80.00 Per barrel with confirmed candle closures above price and above the S&R Zone then I'll Enter LONG and Target the break of the 4Hr Supply Zone price ($81.10 Per Barrel) 110 pts to be exact in our favor... Ill set my stop just below the S&R Zone EQ Level giving me roughly around a 2.7RR....
Remember when it comes to FRM (Financial Risk Management) our job is to manage the downside costs of printing High side returns of $$$ consistently... Let's Step!!
Stay Focused & Reach Excellence!!
#BHM500K #NewERA #Champions

Crude Oil Nearing the End of Wave A of a Zigzag
Oil may be nearing the end of wave A. If so, soon we should see a decline before the next push up to complete the contracting triangle of intermediate degree.

Impending rise for oil prices?If you would like to be notified whenever I post a new article, just click “FOLLOW” at the top. Also, if you would like to elaborate on a particular topic or need some advice, please comment below the article and I will be happy to help.
Impending rise for oil prices?
WTI crude oil futures held steady around $78 a barrel on Tuesday, after rising 3 percent in the previous session on expectations of increased demand for fuel in the summer.
The U.S. government may also fill the Strategic Petroleum Reserve at a faster pace as it aims to buy back oil priced around $79 per barrel. However, I remain cautious as I await the Federal Reserve's policy decision and U.S. inflation data this week.
Positive U.S. employment data released on Friday raised concerns that the Fed may keep interest rates higher for longer, which could hurt the economic outlook and energy demand. Markets will be interested in data on U.S. crude oil inventories from the EIA today.
OPEC+'s announcement to ease production limits by the end of the year has created much discussion about recent changes in oil prices. But personally, I am not worried because if prices continue to fall, the oil cartel may have to delay or cancel the plan to phase down production as early as August.
It would not be surprising if OPEC+ decides to postpone production cuts and announce this decision as early as early August if oil prices remain around $70.
Earlier this week, OPEC+ announced that production cuts of 1.66 million barrels per day will remain in place until 2025. In addition, voluntary production cuts of 2.2 mbpd will be maintained for another three months until September and then gradually reduced.
Lower oil prices are a blow to major oil producers such as Saudi Arabia and Russia. The former needs an oil price above $90 a barrel to balance its budget, while the latter needs an even higher price to support the ongoing military intervention in Ukraine.
Although there may be a decrease in oil prices, this is likely to remain subdued during the summer due to seasonal demand that will keep crude stocks in check.
In the summer season, we expect sustained demand for oil and a reduction in global inventories from July to September. Therefore, we maintain a positive view on oil prices in the summer months.
If you are trying to predict oil prices, there is a highly effective method you can use. Analyze oil producers to determine if their stocks are solid and cheap. With Tradingview you will have an essential tool to properly analyze the fundamental performance of each stock, avoiding costly mistakes.
By using Trading View to analyze Exxon Mobil Corp (XOM), we can see that the stock is strong and attractively priced, which makes me optimistic about oil prices in the future. My prediction is that oil prices will reach $82 in the next quarter.
We look forward to seeing you in the next article! And remember, for successful trading always rely on Tradingview: an indispensable tool that can help you avoid serious mistakes during your trades.

Can the HOUSE CAPITALIZE LONG ABOVE DAILY SWING EQ...?NYMEX:CL1!
1) The 1st confirmation I want to see is price break the last 4Hr Swing High ($76.25) and head towards the EQ Fib level ($76.55)/ 4Hr Supply Zone...
2) Now what happens next is what will determine if we go LONG or not.... The only thing that makes me slightly hesitant in taking this LONG is the fact we have an ascending iR/LQ Trendline currently that buyers have created and I know for a fact Sellers need to sweep this liquidity the question is when will they do it?
3) Once we break above the Fib EQ level ($76.55) I need to see a candle closure above price on the 30m TF & Below... However Price could very much so close above inside the 4Hr Supply then sellers step in and drop price to sweep the iR/LQ then buyers push price rii back up above EQ Level... SO its case by case scenario lets just await and see what happens... Ill keep update as PA prints....
Remember when it comes to FRM (Financial Risk Management) our job is to manage the downside costs of printing High side returns of $$$ consistently... Let's Step!!
Stay Focused & Reach Excellence!!
#BHM500K #NewERA #Champions

Can the HOUSE CAPITALIZE LONG ABOVE DAILY SWING EQ...?NYMEX:CL1!
"To succeed...You need to find something to hold on to, something to motivate you, something to inspire you." -Tony Dorsett
Family, Summer is officially here and I hope everyone is well and in gr8 spirits. Here I am going to give you a detailed narrative as to why I believe we can capitalize LONG on OIL this week juss above Daily Swing EQ Level and Target 70.5% Fib Level Which is the EQ Level of the overall 4Hr Supply Zone.... Risky however still HIGH Probable...Vibe w/me
1) The 1st confirmation I want to see is price break the last 4Hr Swing High ($76.25) and head towards the EQ Fib level ($76.55)/ 4Hr Supply Zone...
2) Now what happens next is what will determine if we go LONG or not.... The only thing that makes me slightly hesitant in taking this LONG is the fact we have an ascending iR/LQ Trendline currently that buyers have created and I know for a fact Sellers need to sweep this liquidity the question is when will they do it?
3) Once we break above the Fib EQ level ($76.55) I need to see a candle closure above price on the 30m TF & Below... However Price could very much so close above inside the 4Hr Supply then sellers step in and drop price to sweep the iR/LQ then buyers push price rii back up above EQ Level... SO its case by case scenario lets just await and see what happens... Ill keep update as PA prints....
Remember when it comes to FRM (Financial Risk Management) our job is to manage the downside costs of printing High side returns of $$$ consistently... Let's Step!!
Stay Focused & Reach Excellence!!
#BHM500K #NewERA #Champions

Repairing the Damage. What's Next for Oil?The chart above is continuous front-month Crude Oil futures. We are referencing the July contract below.
Crude Oil (July)
Yesterday’s close: Settled 77.74, up 2.21
WTI Crude Oil futures notched a fantastic start to the week, gaining 2.93%. It is no coincidence the gain comes on the heels of a strong U.S. Nonfarm Payrolls report on Friday. We have spoken about this often, strong economic data may encourage a risk-off tone by pushing out Fed rate cut projections, but ultimately has a positive impact on Crude Oil in the aftermath. Some of yesterday’s rise could also be credited to consolidation tailwinds ahead of this morning’s OPEC Monthly report that left projections little changed, and prices have initially reacted by coming off session highs. We look to the EIA’s Short-Term Energy Outlook at 11:00 am CT.
Technically, yesterday’s move to reclaim major three-star resistance at 76.15-76.63, the May lows, has neutralized the early June fallout. As today’s session unfolds into tomorrow’s weekly EIA data, it will be critical for price action to hold out above major three-star support at 76.15-76.25 in order to keep the bulls, in our opinion, with their reestablished edge.
Bias: Bullish/Neutral
Resistance: 77.51-77.80***, 78.29-78.16**, 79.32-80.09***
Pivot: 77.35
Support: 76.99*, 76.63**, 76.15-76.25***, 75.53-75.84**
Check out CME Group real-time data plans available on TradingView here: www.tradingview.com
Disclaimers:
CME Real-time Market Data help identify trading set-ups and express my market views. If you have futures in your trading portfolio, you can check out on CME Group data plans available that suit your trading needs www.tradingview.com
*Trade ideas cited above are for illustration only, as an integral part of a case study to demonstrate the fundamental concepts in risk management under the market scenarios being discussed. They shall not be construed as investment recommendations or advice. Nor are they used to promote any specific products, or services.
Futures trading involves substantial risk of loss and may not be suitable for all investors. Trading advice is based on information taken from trade and statistical services and other sources Blue Line Futures, LLC believes are reliable. We do not guarantee that such information is accurate or complete and it should not be relied upon as such. Trading advice reflects our good faith judgment at a specific time and is subject to change without notice. There is no guarantee that the advice we give will result in profitable trades. All trading decisions will be made by the account holder. Past performance is not necessarily indicative of future results.

2024-06-10 - a daily price action after hour update - oilGood Evening and I hope you are well.
overall market comment
Markets went mostly flat today. Dax sears tried and were rejected again and sp500 and nasdaq made higher lows and lower highs. Markets are forming triangles which means we are in breakout mode again. No surprise moving into CPI and FOMC this week. I expect more sideways movement until then.
Commodities all green, while Gold is flat, Oil continued the pull-back big time to get back to 78. Bulls strength surprised me tbh. The pull-back is already too strong for the bear trend to continue much further. Oil trading range is probably 72 - 80 for the next weeks.
wti crude oil
comment: Don’t long at the top of a expanding triangle and after a huge buy climax. In my weekly outlook I wrote that we will hit the daily ema at around 77 again but I obviously did not expect it to be done so fast. Oil was still in a trading range until the breakout above 76.23 but bulls kept at it and the 15m ema held into US close. Since we are at the top of the expanding triangle, I am not interested in buying up here. A pull-back is reasonable here but as of right now, bulls are in full control until bears break below the 15m ema and one should not short into such a strong trend. 78 should be bigger resistance.
current market cycle: Trading range
key levels: 72 - 80
bull case: With today the bear trend concludes imo, since the move was too strong to be part of the bear trend. The 72.48 low could be retested over the next days to weeks but the downside is probably limited to around that area. Bulls want the strong momentum to continue and get most bears stops above 80. It would be insanely strong, if they could break above the bear channel in one giant move over two days. It’s very low probability that this will happen. If it does, we are probably facing an macro event over the next days.
Invalid below 70
bear case: Bears gave up above 76.3 and market moved fast to 78. If bears can not keep it below 78, we will probably melt more up to 80. My line in the sand for bears was around 77-77.5 but bulls melted through. Not many arguments for the bears here until they get below the 15m ema and stop the market from making higher highs.
short term: Bullish af. If this continues, we see 80 soon. If we see 79 in Globex, the chances of an event are big imo. Something is up.
medium-long term: We are seeing the big triangle playing out between 73 and 86 (could also be 87 but for now I see the spike above 83 as a failed breakout of the triangle. We hit the lower trend line and now we will test back up to above 83. —will update this Wednesday
current swing trade: None
trade of the day: I had no interest in buying above 75.5 and under 76.3 but missed the big breakout. Bad trading on my part. Had to get long since bar 9 or latest bar 10.

Turbo Tuesday Crude OilAfter a lavish bullish Monday the next target is the Daily FVG.
Pretty simple
I have a 1hr fvg box if you can see it... that is where price should stay above for price to navigate higher prices heading into NY Tuesday.

6/9 | $CLSince losing the 77 support level, we have flushed lower and rebounded. Holding where it needs to for now, but would still like to give this some time to develop. Messy price action and dont want to be caught in the middle of it. Will be interested if we can either reclaim 77, or price comes back down under 74. Otherwise, will be hands off this week on crude oil.

#202424 - a weekly price action market recap and outlook - oilGood Evening and I hope you are well.
wti crude oil futures
Quote from last week:
bear case: Bears sold 80 again and will probably take profits here at 77 or try to get 76 again. If they get a breakout below, we will probably test 75, which is a price I thought we would test for 5-7 weeks now. It’s a bad sell here at 77 for bears so best they can get is sideways movement.
comment: Fair to say that bears surprised me big time on Monday with the huge follow through selling through previous bigger support. 72 stopped the fall and created an expected bounce. I do think this was W5 and my bearish targets are all met for now. Market should move sideways to up from here. On Friday we got a perfect retest of the breakout price of 76 and that was resistance for now. Worst case scenario for bulls would be to stay below 76. The bull trend line will get retested and should hold for now.
current market cycle: Bear trend which could transition into a trading range here
key levels: 72-78
bull case: The best the bulls can hope for, is for the lows to hold and to move sideways and hit the daily ema again. They failed at keeping it above 75, which was huge support. Last bear leg inside this bigger trading range was 11 weeks long from high to low and we are currently at 9 weeks. Bulls will want to find support here around 70-72 and trade back up to at least 78 over the next 8-12 weeks.
Invalidation is below 71.
bear case: Huge bear surprise imo on Monday and bears want to keep it max bearish and they will do that by keeping the market below the breakout price around 76 and below the daily ema. They want a retest of 72.5 again and poke the bull trend line enough for bulls to give up there. If they actually get an acceleration of this bear trend, which is the low probability thing, they could retest 70 next and below 70 comes 67 as support.
Invalidation is above 80.5.
outlook last week: “R:R is on the bull side here at the bottom of this range. I wait for confirmation on Monday before going long for 80 again. Below 76 we could get to 75 but that would require strong momentum for me to go short down here.”
→ Last Sunday we traded 76.99 and now we are at 75.53. High of the week was 77.52 so the uber bearish price action, was surprising to me. I did not advise you to be bullish, unless there confirmation for the bulls and obviously that did not happen. So my bearish target of 75, if we go below 76, was alright but way too short of 72.48. Not a good outlook.
short term: Neutral because I think we will hit the daily ema again and a retest of 72.5ish. I am not a fortune teller so I don’t know which comes first.
medium-long term: We are seeing the big triangle playing out between 73 and 83. The high of the triangle got tested until mid of April and we have now tested the lows around 72.5. Market will probably move more inside this big range until we get a new big cycle to either side.
current swing trade: None
chart update: Added my pretty bear channel, adjusted 5-wave series and added a two-legged pullback, which we are probably in as of now. The red ABC is how I imagine it to play out price-wise, not time wise. We should see a retest of the lows as well as the daily ema. I don’t know which comes before what or when. Also adjusted the big bear trend line from 2022.

break and retest 22 it broke past the trend line and shot to the downside my prediction was incorrect i thought it was going to retest the trendline and shoot the upside. this is important to pay attention to the whole screen or market and really analysis the divergence and trend rather bullish or bearish, practice!


CRUDEOIL 1HDOUBLE BOTTOM PATTERN IS OBSERVED PRICE MAY TOUCH THE RED LINE AND FALLS BECAUSE IT IS A STRONG RESISTANCE LEVEL
I Am Not SEBI Registered Analyst. All Post and Levels Posting is only for educational and knowledge purpose. I Am not responsible for your any kind of loss or profit.
No Claim, All Rights Reserved.‼️

2024-06-04 - a daily price action after hour update - oilGood Evening and I hope you are well.
wti crude oil
comment: Yeah oil again. This is in play and you should look for strong momentum trades.
current market cycle: Bear trend
key levels: 70-77
bull case: Yesterday I said bulls need to keep it above 74 or we see 72. Low of the day was 72.48. 1h 20ema was resistance and bulls need a close above that. Still the same argument as yesterday. They need to stop new lows and make market go sideways. They also retested the bear channel from last week, from which we broke below, and they were rejected. Only thing they have going for now is that on higher tf you can clearly see 3 pushes down. Would still not look to buy other than scalping.
Invalid below 70
bear case: Globex marked the high of the day and the 15m 20ema was resistance until 1h before US open. From there the market was in a trading range until it touched the 1h 20ema and sold off again. Bears want to keep the momentum going to get to 70 because that would be a clear brake of the bull trend line. Measured move from the last 5 trading days would bring us to 64. Next target for bears is a trade below 72 and then 70 if the momentum keeps going but we are near the lower bear channel line and market will probably need to move sideways to up first.
short term: It’s only going down so look for short entries. I expect a pull-back soon but it could just be a shallow one where we move sideways.
medium-long term: We are seeing the big triangle playing out between 73 and 86 (could also be 87 but for now I see the spike above 83 as a failed breakout of the triangle. We hit the lower trend line and now we will test back up to above 83. —will update this Wednesday
trade of the day: If you weren’t short during Globex, tricky to trade tbh. You could scalp every new high for a short but you really need to know what you are doing. Can also just not trade this or wait for the 1h 20ema touch for a short.

CL waiting for BOS on 15 min to go longCL waiting for BOS and pullback for entry from 15 min fvg LONG

WEEKLY FOREX FORECAST: NASDAQ, SP500, DOW, CRUDE OIL (Part 2)We are covering the indices and crude oil in this video.
Providing analysis for the week of June 3-7th.
