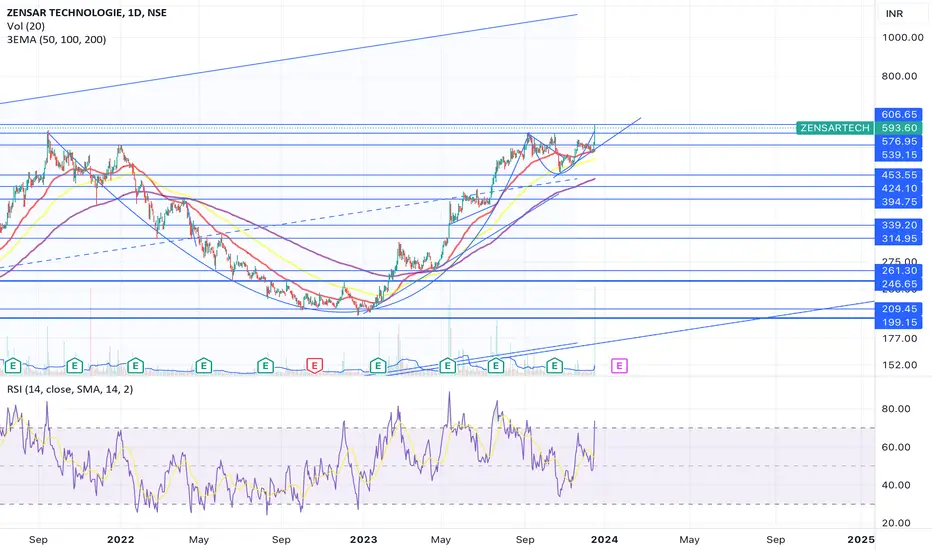
Zensar Technologies breakout1. Breakout of 2021 high.
2. Breakout of cup & handle pattern.
Fib. targets
ZENSARTECH trade ideas

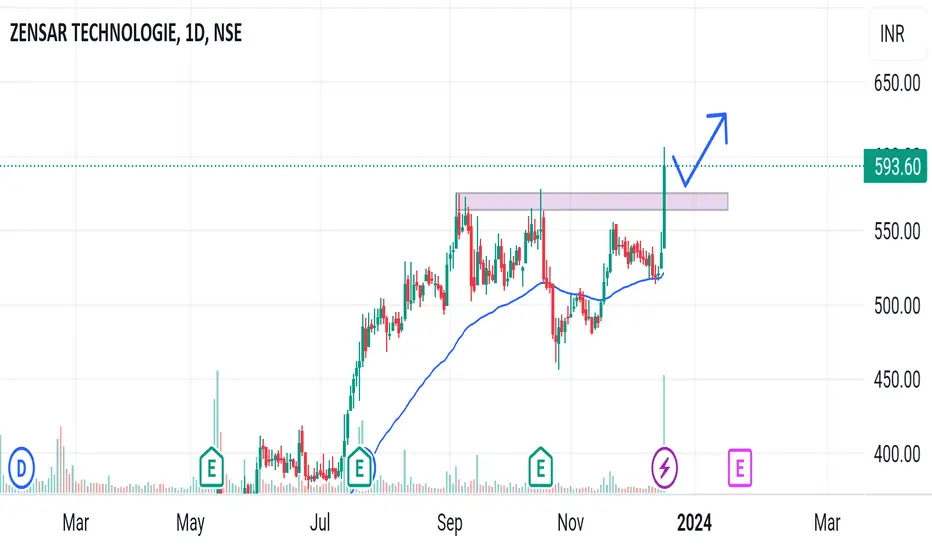
Zensar TechConsolidating near neckline. Current monthly candle closing above the neckline may give sharp bullish momentum.
Disclaimer : Intended for educational purpose only and it's not a buy or sell recommendation.

SWING IDEA - ZENSAR TECHNOLOGIESZensar Technologies , a global IT services provider specializing in digital transformation and technology solutions, is showing strong technical signals for a potential swing trade.
Reasons are listed below :
Head and Shoulder Pattern : This classic reversal pattern indicates a potential shift in trend direction. A completed pattern and subsequent breakout could signify a bullish move.
Breakthrough of Resistance Zone : The 500-550 zone, a previously challenging resistance area, has been decisively broken, suggesting a sustained upward trajectory.
Bullish Engulfing Candle on Weekly Timeframe : This formation, where a larger bullish candle completely envelops a smaller bearish one, indicates a strong shift toward upward momentum.
Breaking a Long Consolidation Phase : Zensar Tech has broken out of a 2.5+ year consolidation, suggesting a new bullish phase and increased market confidence.
Spike in Volumes : A significant increase in trading volume often confirms the strength of a breakout, indicating high investor interest and support.
0.618 Fibonacci Support : This Fibonacci retracement level acts as a strong support, reinforcing the potential for continued upward movement.
Higher Highs Formation : This pattern suggests a consistent uptrend, with each high being higher than the previous one.
Trading at All-Time High : Although this is generally bullish, it's essential to monitor for signs of overextension or potential pullbacks.
Target - 725 // 850
Stoploss - weekly close below 535
Disclaimer :
Decisions to buy, sell, hold or trade in securities, commodities and other investments involve risk and are best made based on the advice of qualified financial professionals. Any trading in securities or other investments involves a risk of substantial losses. The practice of "Day Trading" involves particularly high risks and can cause you to lose substantial sums of money. Before undertaking any trading program, you should consult a qualified financial professional. Please consider carefully whether such trading is suitable for you in light of your financial condition and ability to bear financial risks. Under no circumstances shall we be liable for any loss or damage you or anyone else incurs as a result of any trading or investment activity that you or anyone else engages in based on any information or material you receive through TradingView or our services.
@visionary.growth.insights


ZENSAR broke the resistance and trading at ATH after long time.NSE:ZENTEC
CMP : 700
ZENTEC broke the resistance of 650.

lapu star breakoutA cup and handle price pattern on a security's price chart is a technical indicator that resembles a cup with a handle, where the cup is in the shape of a "u" and the handle has a slight downward drift.
The cup and handle is considered a bullish signal, with the right-hand side of the pattern typically experiencing lower trading volume. The pattern's formation may be as short as seven weeks or as long as 65 weeks.

zensor given break out (educational purpose only)zensor given break out (educational purpose only)
target 605,630,640, 700
sl 3% trailing

ZENSARTECHNOzensartech is currently forming a cup and handle pattern, which is a bullish continuation pattern indicating a potential upward trend. The pattern is characterized by a rounded bottom (the "cup") followed by a consolidation and a smaller retracement (the "handle") before a breakout. The presence of good volume activity further supports the bullish case, suggesting strong interest and potential buying pressure. Traders and investors may want to monitor Zensartech closely for a potential breakout and subsequent upward movement.

ZENSARTECH#ZENSARTECH
ZENSARTECH Good for Holding around 6 TO 9 Months ..... Current Price at 621.50 ......... Keep SL at 594.35 .... (On Closing Basis ... Means ... Daily Candle closed Below 594.35 )….. After Close Crossing 644 …. Trail SL to 639 Targets are Shown on Chart in Greens .
Key Partnerships
Cloud Computing: The co has partnered with Microsoft Azure, Adobe, Amazon web services, Google cloud for CX, Software Engineering, Cloud & Data Relationships
Enterprise application: The co has partnered with Oracle, SAP, Salesforce, and Guidewire for enterprise applications transformation.
Business segments
Digital and Application Services (~83% of total revenue in FY22): It includes Custom Applications Management Services that include Application Development, Maintenance, Support, Modernization and Testing Services across a wide technology spectrum and Industry verticals.
Digital Foundation Services(~17% of total revenue in FY22)
Infrastructure management services includes Hybrid IT, Digital workplace, Dynamic Security and Unified IT provided under managed service platform using automation, autonomics and machine learning.
As of Q3FY23, Net cash of $179.4M
As of Q3FY23, Total headcounts stood at 10,845

Post breakout consolidation on ZensartechStock has recently made an all time high.
currently in a post breakout consolidation and moving upwards.
consistently outperforming CNX500.
looks good for a target of 1000.
Breakout volumes are good and current week also has a volume spurt.
Also has a trendline confluence at 950-1000.
Big buy with a stop loss of 500

ZensarTech - LongZensarTECH
Buy Above 595
For Target : 679-1015-1691
SL 198
Reason for Pick - Breakout Given, Traded in High Volume
Please consult your financial advisor before investing
All research for educational purposes only.

Cup and handle breakout ZENSARTECH in 1D timeframe.
Made cup and handle pattern in daily timeframe and broke its neckline and retested it and made a bullish engulfing pattern at support. It's a really good sign to go long. It's only my view not a recommendation. Please do some of your own analysis before entering into any trade and calculate your Risk Reward Ratio.

Best intraday setup in 15 minsBest for intraday. Broken daily timeframe trendline, retested and formed bullish engulfing pattern at support and again trendline is going in 15 mins. If that breaks and sustain, it will go up. It's good for swing and intraday. It's only my view not a recommendation.

Zensar Technologies has given a breakout on weekly chartZensar Technologies has given a breakout of cup and handle pattern on weekly chart with huge volume buildup
company has almost debt free debt to equity ratio - 0.07


ZENSARTECH: Brewing Success in a Cup and Handle FormationZENSARTECH (CMP: 617.35) presents a compelling opportunity with the formation of a classic cup and handle pattern. This bullish technical setup suggests a potential upward trend reversal, making it an exciting prospect for traders and investors.
Key Points:
Cup and Handle Formation:
The stock has traced a cup-like pattern, indicating a period of consolidation and accumulation, followed by a smaller pullback forming the handle. This pattern often precedes a significant upward move.
Current Market Price (CMP):
The current market price at 617.35 positions us at the potential breakout point, providing an advantageous entry for those looking to ride the anticipated bullish momentum.
Stop Loss at 455:
To manage risk, a prudent stop-loss level has been set at 455. This level is strategically chosen to allow for a reasonable buffer while protecting against unexpected downturns.
Target at 1365:
The target of 1365 aligns with the projected upward move based on the cup and handle pattern. This ambitious but realistic target takes into account the depth of the cup and offers an attractive risk-reward ratio.
Important Note:
I am not a SEBI registered advisor. Trading involves risk, and it's crucial to stay updated on market conditions and adapt your strategy accordingly. This idea is based on technical analysis, and it's recommended to conduct thorough research and, if possible, consult with financial professionals before making any trading decisions.

zensartech for investmentzensar give a good return for long term
zensar breakout indicate it will give a very good reurn for invetmet

Zensar tech: a non-zen move?a close of 607 with good volume will give us a reliable CnH breakout. This scrip is under blue sky, the stock has slept a good sleep and it has woken in last few months only, we may see a violent run.
ZensartechStock name = Zensar Technologies Limited.
Weekly chart setup
Chart is self explanatory. Levels of breakout, possible up-moves (where stock may find resistances) and support (close below which, setup will be invalidated) are clearly defined.
Disclaimer: This is for demonstration and educational purpose only. this is not buying and selling recommendations. I am not SEBI registered. please consult your financial advisor before taking any trade.

ZENSAR TECH SWING TRADE IDEAZENSAR TECH gave weekly resistance zone breakout with strong bullish candle and gud volume bar after retesting double bottom neck line breakout of daily time frame can play for swing with your RR.

ZENSAR TECH LONG WEEKLY CHARTZensar Tech has given a breakout after a long consolidation base formation.
Target levels marked over the chart.
Invalid below 530

ATH BO IN ZENSAR TECHNOLOGY, Favourable RR.Pick of the week:
Breakout of ATH, confirmation on WTF.
Volume support.
Overall, the structure looks good.
+IT sector is on rise.
Favourable RR.
Keep in your watchlist.
No Recommendations please.
