NiftyToday is temporary top of this week.
We may ready to retest 22750 in next one to days.
India vix shows more volatile market in coming days.
NIFTY trade ideas

nifty important levels for tomorrow, Monday, 3rd June 2024nifty important levels for tomorrow, Monday, 3rd June 2024
No trade Zone between 22656 and 22467
Resistance 1 22800
Resistance 2 22941
Support 1 22334
Support 2 22209


NiftyToday on daily time frame new life time high with inverted candles.
Important support 22900 to 22750 and resistance 23250.
We may test 23250 in next week.

NIFTY DAILY - 24/5/2024Nifty opens lower and made day low which is 22908 level, afterwards bulls drag the market upside and made All Time High that is 23026 level.
Nifty was highly volatile throughout the trading session, Nifty traded in between +50 points to -50 points for whole day.
Index has formed green body candle with long upper shadow which indicates seller were selling from days high.
Candle is trading at upper band of Bollinger Band.
Nifty is able to hold 22900 so, further resistance can be 23059 level with support of 22716 level.
Bank Nifty levels
Support – 48677
Resistance – 49334
Today’s Advance Decline ratio of NIFTY50
Advance - 17
Decline - 32 Unchanged – 1
FII Sell – 944.83 crores
DII Buy + 2320.32 crores.
⚠️ Important: Always maintain your Risk & Reward Ratio.
✅Like and follow to never miss a new idea!✅
Disclaimer: I am not SEBI Registered Advisor. My posts are purely for training and educational purposes.
Eat🍜 Sleep😴 TradingView📈 Repeat 🔁
Happy learning with trading. Cheers!🥂

Nifty What ifs? it is 2004 again / seats are close to 400. Last phases of election are going on the result will be declared on 4th June the talk of the town is what will happen to Nifty if election is won by someone who is expected to win the general elections in India and what will happen if the results are unexpected. We can not predict elections and we can not predict how the Nifty will behave but certainly the charts which are representations of human emotions tell us a story and give us projections which we have seen are very close to being accurate. We have taken the help of Fibonacci retracement and parallel channel to help us understand where human emotions can lead Nifty to.
Scenario 1) 2004 (History repeats itself)(Thunder seldom strikes twice in the same place but what if?)
Let us talk about unexpected scenario like what happened in 2004. In this case market will definitely market will take a hit. The support levels for Nifty in such a case will be 20391. 20391 happens to be our channel bottom additionally it is also a Fibonacci support.
If the Nifty falls below 20391 which it potentially can as investor emotions rather than valuations will take precedence the next support will be at 18688. In case 18688 will not hold (which is unlikely) worst case scenario as of now is Mother line support 50 Months EMA is at 17358. (This is what chart tells me as of now). In case of hung parliament / policy paralysis / War like situation at border and major internal strife Nifty may even fall to 15471.)
In short there will be a lot of wealth erosion initially but nevertheless market will stabilize and upward journey will definitely begin once again if the euphoria of loss settles down. As companies will adjust / adapt and keep performing. The show will go on. When Trump lost US experts were saying that US market will have a free fall but against all odds US markets saw new highs in Biden term. Always remember that markets are unpredictable.
Scenario 2) Seats are close to 350 or 400.
The Euphoria and mad valuations in some stock might continue for a while but surely there will be Profit Booking fall sooner than later. The Major Nifty Resistance is near 23608 which also happens to be a mid channel resistance. That can be a potential point of profit booking. If we get a closing above 23608 which is less likely in near term, but you never say never. Or whenever in future we get a closing above 23608. This will open the doors for long term target of 27K. In 4/5 years time the best case scenario seems to be Nifty between 27 and 30K.
Scenario 3) Seats are between 250 and 300. It will be victory or close to victory nevertheless it has potential to damage emotions of the investors and profit booking cycle can begin right then and there. 21376 or 20391 is possible even in such a scenario. Eventually when dust will settle and valuations are affordable again Nifty will restart it's journey towards 23608 in this case.
I hope that the above Technical analysis will help you in bracing yourself for impact on D-day that is 4th June. Even if the landing is going to be smooth airlines always asks us to wear seat belts. In cars also we wear seat belts for safety. On bike we are supposed to wear helmets. What are all these equipment for? Safety.
Safety mechanism of Stock market is Stop loss and Trailing stop loss. Keep them in a proper place whether it is scenario 1, 2 or 3. It will save you in case of scenario 1 or 3. Incase it is scenario 2 some of your stop losses may be hit and then the stock will run upward but remember it will be loss in profit. Loss in profit is better than loss. No one in the world has become a pauper by keeping stop losses.
Disclaimer: There is a chance of biases including confirmation bias, information bias, halo effect and anchoring bias in this write-up. Investment in stocks, derivatives and mutual funds is subject to market risks, please consult your investment advisor before taking financial decisions. The data, chart and other information provided above is for the purpose of analysis and is purely educational in nature. The names of the stocks or index levels of spot Nifty mentioned in the article are for the purpose of education and analysis only. Purpose of this article is educational. Please do not consider this as a recommendation of any sorts.

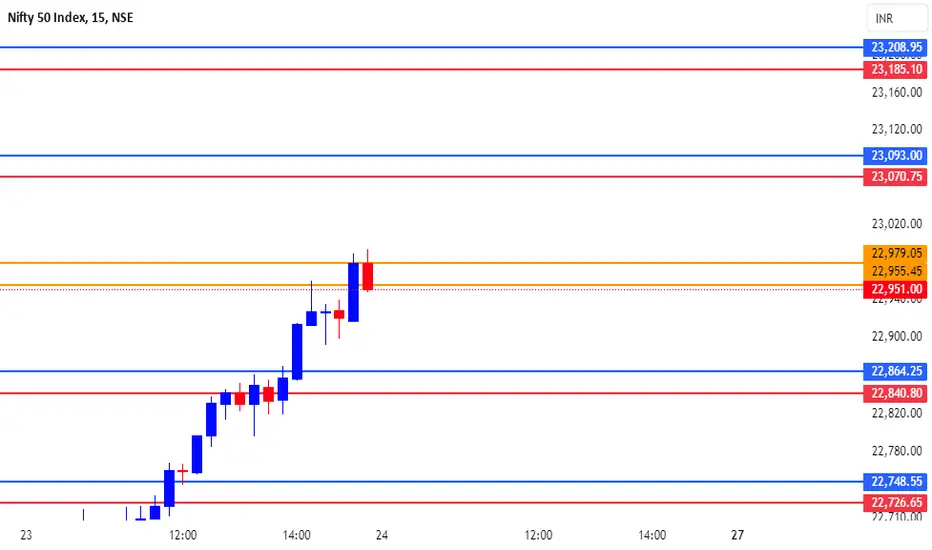
NIFTY TRADING LEVELS FOR 24-05-2024Explanation:
This is a very useful trading system. This means that you should not take a trade blindly, but rather that there is another confirmation to take the trade you can use this for perfect entry and perfect exit
This trading opportunity is based on volume, previous price, and price range , are included
Entry/Exit point's:
- It has very easy entry and exit points
- In this pair of lines with two colors are given (RED AND BLUE)
- In this the blue line is used to take long entry and the red line is used to take short entry (But it is all based on a more conformation from your trading plan)
Stop Loss/Take Profit:
Stop Loss
- According to this, if you take a long trade, its stop loss will be the red line just below ( A trade can exit either when the price crosses the red line or the 5 minute candlestick crosses the red line. (This can be done according to your preference) )
- A short entry should use the opposite rules to a long entry
Take Profit
-When you take a long entry according to the profit to be booked is on the next red line above. ( Or if there are other reasons, it can be a safe exit )
- Opposite rules for booking profit on long entry are to book profit on short trade. ( The blue line above is the stop loss of short entry )
Timeframe:
According to this, the time frame you should use while taking trades is 5 minutes time frames . (5 minute time frame works well in this)
Risk Disclaimer:
Trading carries significant risk and is not suitable for all traders. You may lose some or all of your capital in a matter of minutes or hours. Market conditions can change rapidly, and prices can move against you quickly. You may not always be able to exit at a favorable price, and you may be required to hold a position overnight, exposing yourself to additional risk. Day trading involves high risk, high leverage, and high stakes, and you should only trade with funds you can afford to lose. Please carefully consider your financial situation, risk tolerance, and trading objectives before engaging in day trading.
Engagement:
Share your insights, ask questions, and learn from others in the community. Whether you're a seasoned pro or just starting out, we're all in this together.
What's your take on the current market conditions? Which trading strategies are working for you? Let's discuss and help each other grow as traders!
Comment below and let's get the conversation started!
Original Content:
This trading setup is the result of my own innovation and expertise, and is not based on any publicly available information or third-party systems. It is a reflection of my dedication to developing a competitive edge in the markets.
Nifty important levels and trade plan for Friday, 24th MayNifty important levels and trade plan for Friday, 24th May
In daily time frame Nifty is in an uptrend, and we will mainly focus on bullish trades tomorrow, unless Nifty forms a bearish price action in minimum 15 Minute time frame.
22985 which is almost at the all time high for nifty will be the levels of concern for tomorrow, and Nifty opening below that level, after crossing that particular level will go for bullish trade. 23049, 23145 and 23319 will be the resistance levels. There may be an intermediate resistance level between 23145 and 23319, but due to current price action and unavailability of historic data, it is hard to find. In case of opening above 23985, will wait for a price action to complete and then will enter into bullish trade in case of positive price action in 5 minute time frame, and with bearish price action in 15 minute time frame at the resistance levels plotted, may plan for downside trade, but with limited quantity.
For down side below 22985, will wait for nifty to cross 22850, and then with a price action in 15 minute time frame, may go for bearish price action. 22765, 22696 and 22628 will be the support levels, however in all condition in bearish trade our quantities will be limited.
*This analysis is most effective up to 12:30/1 PM tomorrow*
*Personal opinion, not a trade advice*
*Support and resistance levels are based on Fibonacci*

Blood bath soon ?#Bloodbath #nifty50
Mark my words...
Closing below 22800 could be lethal for the market.

NIFTY Trading Plan for 23-May-2024
Context:
On the 22nd of May, 2024, NIFTY traded near its resistance level of 22586 throughout the day. Due to the Bank NIFTY expiry, prices remained muted until the last 30 minutes, when we saw a breakout. NIFTY closed above the resistance level of 22586, confirming an upward move for the next trading session on the 23rd of May.
Trading Strategy:
Gap Up Opening (22700-22750):
If NIFTY opens above 22700 and sustains this level during the first trading hour, it can move higher towards the target of 22800.
Expect resistance near 22800.
If prices do not sustain 22700 and start trading below this level, look for buying opportunities near 22600-22580.
If prices break 22550, consider a short trade with a stop loss (SL) at 22590 and target 22465-22443.
Flat Opening (Above 22600):
If NIFTY stays above 22600, aim for a target of 22700.
Above 22720, the prices can target 22800-22810.
Look for buying opportunities with a SL at 22550.
If prices start trading below 22550, wait and look for buying opportunities near 22465-22432 with a SL of 22400 and target 22580-22600.
Gap Down Opening (Below 22538):
If prices quickly recover and stay above 22600, aim for a target of 22700-22800 with a SL below 22550.
If prices do not recover and stay below 22532 for the first trading hour, consider a short trade targeting 22465-22443.
Below 22400, prices can potentially drop to 22300.
Conclusion:
Be prepared for different market conditions by setting appropriate stop losses and targets. Adjust your strategy based on the opening and early price movements.
Disclaimer:
This trading plan is based on technical analysis and market conditions at the time of writing. Market conditions can change rapidly, and it is important to conduct your own analysis or consult with a financial advisor before making any trading decisions.

NIFTY: Trading Plan for 24-May-2024
After the impressive movement we saw on Thursday, 23 May 2024, where prices hit our targets precisely, we might expect a more relaxed trading session on Friday, 24-May-2024. However, we should be ready for various scenarios. Here’s our plan:
Gap Up Opening
Above 23000: If prices open above 23000, they might face resistance near 23059 and trade sideways.
Above 23060: Prices can rise towards 23142.
Below 23000: Prices might find support at 22917-22897.
Below 22880: Look for support at 22803-22800.
Flat Opening
Support at 22915-22897: If prices open flat, they might first take support here.
Upside: After finding support, prices can move towards 23000-23059.
Below 22880: If this support fails, prices could drop towards 22800.
Gap Down Opening
Below 22880: If prices open below this level and stay there for the first hour, expect a drop towards 22800.
Recovery above 22915: If prices quickly recover above 22915, look for a move towards 23000-23059.
Conclusion: While a sideways session is likely, be prepared for quick movements in either direction based on these key levels.
Disclaimer: Trading involves risk, and past performance is not indicative of future results. Make trading decisions based on your own analysis and risk tolerance.

NIFTY S/R for 27/5/24Support and Resistance Levels: In technical analysis, support and resistance levels are significant price levels where buying or selling interest tends to be strong. They are identified based on previous price levels where the price has shown a tendency to reverse or find support.
Support levels are represented by the green line and green shade, indicating areas where buying interest may emerge to prevent further price decline.
Resistance levels are represented by the red line and red shade, indicating areas where selling pressure may arise to prevent further price increases. Traders often consider these levels as potential buying or selling opportunities.
Breakouts: Breakouts occur when the price convincingly moves above a resistance level (red shade) or below a support level (green shade). A bullish breakout above resistance suggests the potential for further price increases, while a bearish breakout below support suggests the potential for further price declines. Traders pay attention to these breakout signals as they may indicate the start of a new trend or significant price movement.
Disclosure: I am not SEBI registered. The information provided here is for learning purposes only and should not be interpreted as financial advice. It is important to consult with a qualified financial advisor before making any investment decisions. Tweets neither advice nor endorsement.

NIFTY INTRADAY LEVELS FOR 23/05/2024BUY ABOVE - 22640
SL - 22590
TARGETS - 22710,22780,22830
SELL BELOW - 22550
SL - 22590
TARGETS - 22500,22440,22350
NO TRADE ZONE - 22550 to 22640
Previous Day High - 22640
Previous Day Low - 22500
Based on price action major support & resistance's are here, the red lines acts as resistances, the green lines acts as supports. If the price breaks the support/resistance, it will move to the next support/resistance line. White lines indicates previous day high & low, high acts as a resistance & low acts as a support for next day.
Trendlines are also significant to price action. If the price is above/below the trendlines, can expect an UP/DOWN with aggressive move.
Please NOTE: this levels are for intraday trading only.
Disclaimer - All information on this page is for educational purposes only,
we are not SEBI Registered, Please consult a SEBI registered financial advisor for your financial matters before investing And taking any decision. We are not responsible for any profit/loss you made.
Request your support and engagement by liking and commenting & follow to provide encouragement
HAPPY TRADING 👍

Nifty 50As per previous data Nifty touched 23000 within 35 days (Avg)
support will be 21900/21800 zone
If it breaks then the next support will be 21500
day candle is also an important level to watch for short.
bull hai to slow move Karega.
After CROSSING 22500 it will become super bullish.

NIFTY: The ploy in the plot! It was there for all to see; we simply chose to ignore it.
1. Huge shorts by FII (one can debate the internals, but the psyche was there once certain levels are broken the short covering to ensure, the volume spike post the break of ATH supports this)
2. The 400 plus is the ploy played to trap the opposition, PM statements, is clear that if the market is factoring this point, then the adjustments will have to be made. You won't get any more admissions like this.
3. Now it all depends on the Exit polls and actual polls, we will do that one day before that.
4. Continue to believe, this week close candle is important, and that has happened too fast to the discomfort of many including us.
5. Confluence of resistance ranging from 23108-23260 suggest that would be difficult to cross, while bears need min close below the previous ATH that is 22800.
6. We circle around and move with higher base is the first impression. However, do not believe that the short covering is done and dusted, they are done part and moved into safer places of individual stocks.
7. A cursory look of the graph suggests that the price action remains within the channel and more so above the Mid of the Channel and recent move below that a failed one. What is interesting to see is the supply line drawn with the previous highs and the channel one both are close.
8. Optically looks good to enter, but as always, the dips are safer than just jumping buy.
Circling the 22800-23100 range for the day.

Nifty 50 - Skewed TringleSkewed Triangle
If a very strong trend takes place, we could face a Skewed Triangle, its wave D is longer than wave B. So. It’s the only type of triangle, which has a direction towards the main trend. This pattern is rare and we should mark it as the last possible scenario. The following Nifty 50 chart represents a Skewed Triangle, which pushed the price higher into the fifth wave.

NIFTY DAILY - 23/5/2024Nifty opens with positive note and bulls were aggressive from starting of the day, nifty made All Time High Record which is 22993 level with almost 369 points up which is around +1.64%.
Nifty has formed a big body bullish candle with small lower and upper shadow.
Candle is trading at upper Band of Bollinger Band and giving breakout of it.
Double Moving Averages are giving Crossover on Daily Chart.
Nifty has crossed the resistance level which was 22610 so further resistance can be 23059 level with support of 22716 level.
Bank Nifty levels
Support – 48677
Resistance – 48832
Today’s Advance Decline ratio of NIFTY50
Advance - 44
Decline - 6
FII Buy + 4670.95 crores
DII Buy + 146.51 crores.
⚠️ Important: Always maintain your Risk & Reward Ratio.
✅Like and follow to never miss a new idea!✅
Disclaimer: I am not SEBI Registered Advisor. My posts are purely for training and educational purposes.
Eat🍜 Sleep😴 TradingView📈 Repeat 🔁
Happy learning with trading. Cheers!🥂

U-formation on cards if resistance at 22632 is cleared by Nifty.It looks like Nifty can create a U formation if the resistances at 22632 is cleared and we get a proper closing above it. However for perfect U-formation the Nifty will have to cross other resistances at 22693, 22734, 22768 and finally 22794. In case we do not get a closing above 22632 and Nifty returns the supports for Nifty will be at 22536, 22484 and 22445. Below 22445 there are important support levels of 50 and 200 EMA which are 22409 and 22345. Below 22345 Nifty becomes very weak and Bears take over the market. Shadow of the candle is neutral to positive for tomorrow.

23500?Yesterday's high and low could be the range you want to look for. Let us see what the big hands have in store for Nifty. Will prefer to wait and watch before entering positions as US saw a good sell off from ATH and it was sudden.

ATH Breakout for Nifty but has the rally got more steam?Major ATH All Time high Breakout for Nifty today however Nifty could not cross the much coveted level of 23K. Can Nifty do to it tomorrow? has it got the steam? RSI is high indicating that Nifty is getting overbought and valuations of a lot of stocks are very pricey. However there might still be opportunity left in a few Large cap stock specially IT, Banking and Finance space which have fallen out of favour of investors lately. Valuations in some PSU, Mid and Small Case space are questionable currently and we advise keeping a strict trailing stop loss wherever you have good profit.
Remember nobody has ever become a pauper by booking profits. Keep strict trailing Stop Losses. They are best friends. Loss in Profit is ok but Profit to loss is not ok.
Nifty Major Supports levels: 22784, 22507 and 22298.
Major Future resistance levels: 22293, 23060, 23208 and 23407.

Nifty As per our previous prediction nifty hits new life time high.
Important support 22800 and resistance 23000.
Closing above 23000 will open a new target 23240 and 23500.

Nifty: Modi 3.0Trading in a band
A high might be made around 23000 on 31st May
1st sat
2nd sun
3rd: Exit Polls Out
4th Results !
Namo Namo

NIFTY S/R for 23/5/24Support and Resistance Levels: In technical analysis, support and resistance levels are significant price levels where buying or selling interest tends to be strong. They are identified based on previous price levels where the price has shown a tendency to reverse or find support.
Support levels are represented by the green line and green shade, indicating areas where buying interest may emerge to prevent further price decline.
Resistance levels are represented by the red line and red shade, indicating areas where selling pressure may arise to prevent further price increases. Traders often consider these levels as potential buying or selling opportunities.
Breakouts: Breakouts occur when the price convincingly moves above a resistance level (red shade) or below a support level (green shade). A bullish breakout above resistance suggests the potential for further price increases, while a bearish breakout below support suggests the potential for further price declines. Traders pay attention to these breakout signals as they may indicate the start of a new trend or significant price movement.
Disclosure: I am not SEBI registered. The information provided here is for learning purposes only and should not be interpreted as financial advice. It is important to consult with a qualified financial advisor before making any investment decisions. Tweets neither advice nor endorsement.
