Apple for swing trade and. May be it touches all time highIn 1d time frame it look like bullish trader so low risk high reward trade, very crucial support at 200 daily EMA, KEEP YOUR EYES ON, May be it touches all time high
AAPL trade ideas

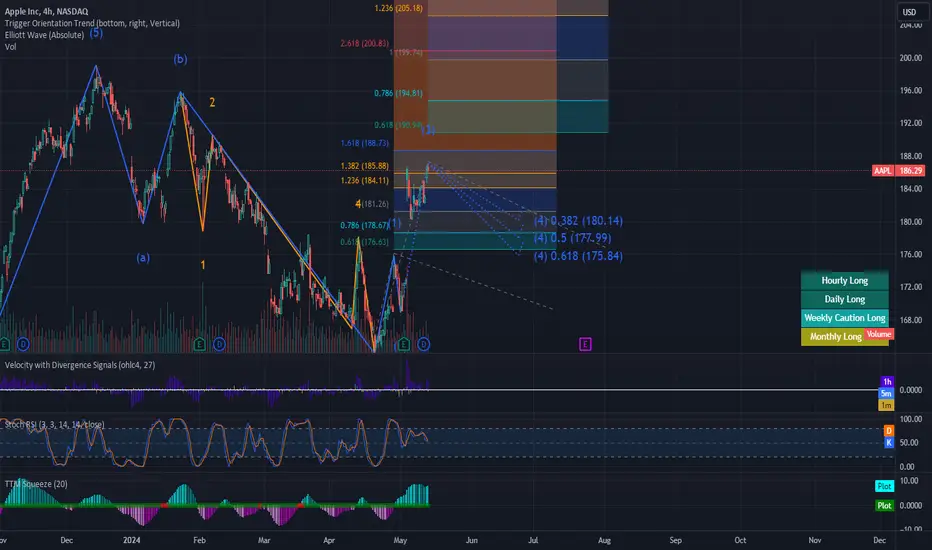
What's ahead for Apple? Watch the video for update!188 is a price zone to watch for now. I had anticipated the price movement till 192-193 about 2 months ago and it acted according to the best case scenario drawn. Now it's time for some correction and even the S&P looking bearish, let us witness Apple come down a little before further conclusions can be drawn.

Eyeing $240Looking at it we are on a bullish run with the 6 months chart closing as a bullish engulfing. I'm expecting pull back to that price since.

Members Daily Analysis - May 22 2024Markets Sold off: IWM (Small caps) underperformed.
Most commodities hit on the downside: Gold, Silver, Copper, Oil
Natural Gas surging & squeezing
NVDA pumping on earnings: Our SOXL calls will print.
SemiConductors i'll be trading tomorrow. NASDAQ:ON , NASDAQ:SMCI , NASDAQ:ARM

AAPL at a crossroadsApple seems to have just broken out of a descending triangle. Although seemingly bullish, there is bearish divergence on the RSI, the stochasting RSI is also pointing straight down on the daily after just crossing (see update below for indicators). A pullback is likely on its way. The interesting thing to watch will be if the previous resistance from that descending triangle turns into support or falls through rather quickly.
In my opinion, the lower volume breakout to me does not ascertain a bullish environment, coupled up with the indicators listed above. Travel with caution in the meantime, it does not seem like the time to chase a trade.

AAPL Scalping Zones 5/22Outlook
-Apple finally broke out of that tight range and POC
continues to move up supporting the move. 191.77
must hold for continued upside but with VIX looking bullish i'm
cautious on upside targets.
Upside Targets:
* 192.68/193.15/193.6
Downside Targets:
*192.2191.75/191.36
Daily Trend Tracker -
*AAPL+ *DXY+ *VIX+ *US10Y+

AAPLPair : Apple Index
Description :
Completed " 12345 " Impulsive Waves
Break of Structure
RSI - Divergence
Fibonacci Level - 161.8%
Rising Wedge in Short Time Frame

Short $AAPL between $191-196. Target below $100?NASDAQ:AAPL is starting to look like a really great short opportunity. As you can see from the chart, the bullish trend that started in 2020, broke down in 2022 and hasn't been able to confirm support above it.
We confirmed resistance on that trend line in August and now looks like we're going back to test it one more time. I'd imagine this time, it won't break through and we should see a strong downward reaction afterwards.
I think we'll see price fall after that December pivot and then bottom sometime before 2025 at the lower support level.
Let's see how it plays out over the coming year.

AAPL Scalping Zones 5/20Outlook
-Apple falls premarket after reports of slashing iPhone prices
in China amid fierce Huawei competition
-Apple has been trading in a tight range and had a lot of selling
volume going into market close friday. Would need 188.8 to
hold for any upside potential. Weekly and daily still bullish so
will look to go long on open if selling pressure seems exhausted
Upside Targets:
* 189.34/189.93/190.77
Downside Targets:
*188.93/188.6/187.46
Daily Trend Tracker -
*AAPL+ *DXY+ *VIX- *US10Y+


APPLE: Short Trade Explained
APPLE
- Classic bearish setup
- Our team expects bearish continuation
SUGGESTED TRADE:
Swing Trade
Short APPLE
Entry Point - 189.93
Stop Loss - 195.31
Take Profit - 180.47
Our Risk - 1%
Start protection of your profits from lower levels
❤️ Please, support our work with like & comment! ❤️

Apple looking fruity.With strong fundamentals plus released numbers beating what the experts have predicted, is it safe to say apple Inc is heading to new heights? Yes the sales are down.. for now, but have you seen what apple has in store for us in 2025? Quite penny stocks trading and buy right companies at the affordable price.

Short AAPLApple is back at the underside of the 2003 uptrend support, now resistance. Chart AAPL/SPY ratio and it is also at a resistance level.


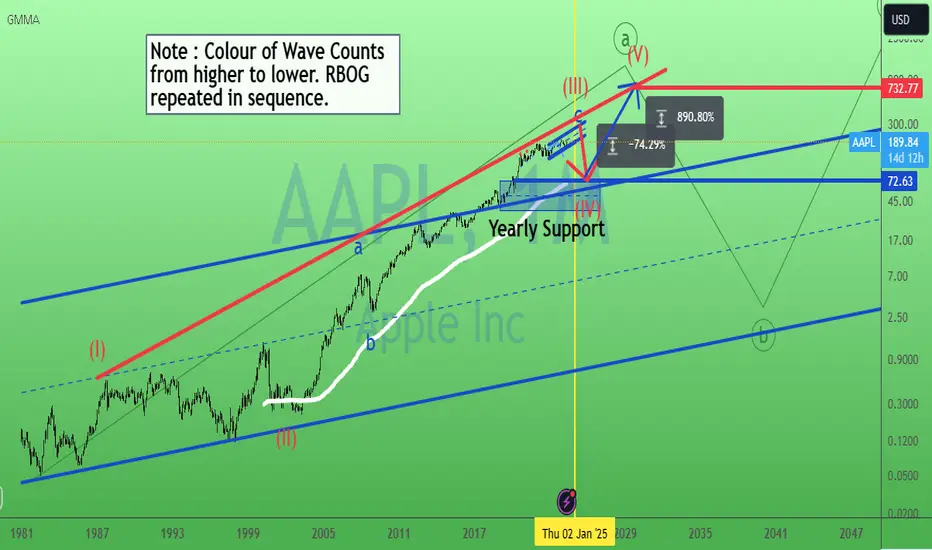
Apple bigger pic. 17/May/24AAPL bigger picture on monthly chart, possible a more than 70% (-74.29&) drop on year 2025 toward 72.63 +/- which is multi confluence zone of 1) Monthly 233 EMA ( thick white MA line) 2)Upper Support of parallel channel ( blue line) 3) Yearly Support Zone.
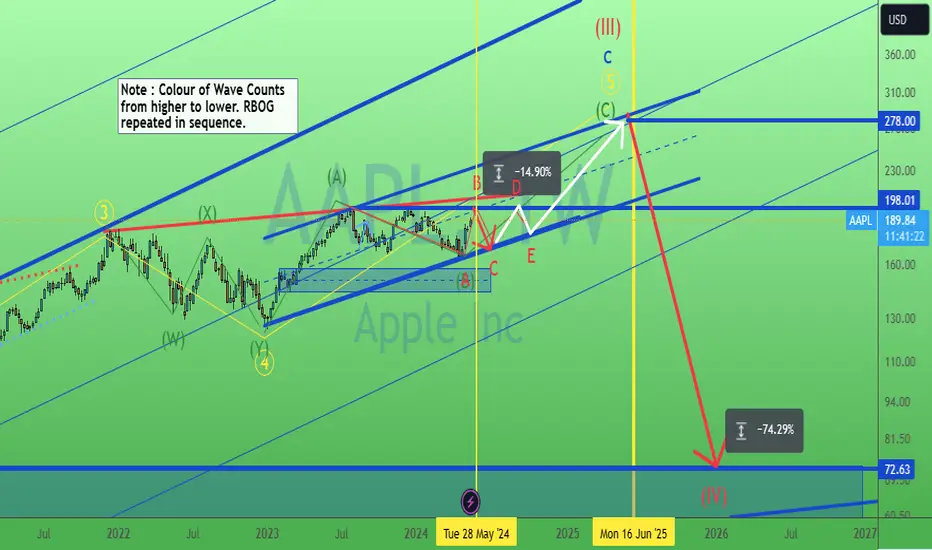
Apple still not out of wood (triangle). 17/May/24AAPL still forming a triangle pattern. Probably a -14.90% drop by end of May ( so sell in May still working") or early June.
Navigating Investment Decisions with Tradingview: Apple exampleHello,
Investing and trading can easily scare participants in most cases. However, the different tools that Tradingview offers can make the work easier for you the investor. In this case I will be using a candlestick chart, a closer look at the price action, The date & price range tool, The vertical line tool and a combination of the financial data provided on the TV platform.
1st, My goal is to seek to understand the company. This can be done on the tradingview platform. This is very important because it builds a base on how the company makes its revenue as well as how its costs would look like. As per the platform.
www.tradingview.com
Apple, Inc engages in the design, manufacture, and sale of smartphones, personal computers, tablets, wearables and accessories, and other variety of related services. It operates through the following geographical segments: Americas, Europe, Greater China, Japan, and Rest of Asia Pacific.
Investing is greatly an act of faith and understanding how the organization has performed in numbers is very key. Although this cannot be assurance that the company will keep performing that way in future, the Tradingview platform gives you a historical view of how the company has performed, its asset quality vs liabilities as well as the cashflow positions. The above for our specific company can be found here www.tradingview.com
Once you have understood the story of the company and linked your narrative to the numbers, very key is to understand key upcoming events for the company and also how investors have reacted to the share price over a considerable period of time.
Our company apple has ranged between prices of USD 165 & USD 200. This is since July 2023. The company continues to be in a range for that period and is currently trading at around USD 168.45. This gives us a great entry price since the company's fundamentals remain quite strong. Using the date & range tool shows us that the company took 99 days to move from price USD 198 to USD 166. This represents an erosion of -16% but still a short opportunity. The company then took 51 days to move back to its top of USD 198 per share.
Just by merely looking at how fast the company is rising when it hits our bottom is great to show that the upwards momentum is stronger. Using this I shall be looking for buy opportunities from our current level with my target at the top.
The vertical line is very key in helping us know where we begin our analysis.
Very key also to bring into the analysis is the aspect of risk management which helps us set targets as well as identify areas where we need to exit our trades & relook at our analysis once again.
Conclusion:
Tradingview offers powerful tools that empower investors to make informed investment decisions. By leveraging features such as financial data analysis, market sentiment tracking, technical analysis, and risk management, investors can navigate the complex world of investing with confidence. Using Apple Inc. as a case study, we've demonstrated how Tradingview's tools can enhance investment strategies and drive success in the dynamic financial landscape.

Apple ,,, Watching In my idea, after confirmation above 187, it will enter to a new uptrend.
Based on my strategy, breakout of a descending trend line then passing out of a price level can be considered as a new trend.
About 180 could be a sure spot for setting the SL.

APPLE TO 189-190NASDAQ:AAPL NASDAQ:AAPL
After breaking through former Bearish FVG, while in a bullish pennant, APPLE has made a breakout. I expect price to reach 189-190 soon.

$AAPL Bearish To Bullish Reversal NASDAQ:AAPL Bearish To Bullish Reversal, parallel down trend break out to the upside.

The idea of a bull marketEsteemed analysts and traders,
I hope this correspondence finds you in good health and high spirits, prepared to tackle the upcoming week with renewed energy. I extend my best wishes for your continued success in all your business endeavors. It is worth noting that success in trading is largely dependent on the consistent definition and adherence to one's own rules.
As a supporter of the Elliott Wave Principle, I consider this methodology an invaluable tool for market analysis. After three years of personal experience, I have developed my approach by combining this principle with meticulous consideration of different market scenarios. I strive to avoid market surprises by maintaining a range of market prospects, which enables me to recognize the market structure forming with 100% accuracy.
I am pleased to share my analysis with you, with the caveat that I do not provide buy or sell signals. My perspective on idea analysis is entirely impartial, and if my analysis meets your standards, it may serve as a guide to making an informed decision.
For your reference and comparison, I have attached my previous analysis of the same market. All the details of my analysis are clearly labeled for ease of comprehension. Nonetheless, familiarity with the Elliott Wave Principle theory would facilitate an understanding of the analytical idea.
My study of the Elliott Wave Principle took nearly three years, during which my understanding and experience with this invaluable tool have grown. My progress thus far is a testament to the legacy of Ralph Nelson Eliot, whose genius has provided the foundation for my achievements. May he rest in peace.
I express my gratitude for your continued support and kindness, and welcome your comments and critiques.
May my analysis be a valuable asset to your business journey, and I remain sincerely yours,
Mr. Nobody

Apple price fall because of S&P 500 correction to 3900 range.Trade at your own risk.
Apple since 2003 price at USD0.32 has breakout to USD197 at the recent peak. The stock is currently having a correction since S&P 500 is also having a correction from peak 4605 to around 3900 to 3850. 15% correction.
Apple current price USD166.89 will drop to the 4 hours support level at USD161.41. If there is a breakout, then the price will head to USD142.23 at 1 day support level. The price will not drop to USD112.77 the 1-week support level as we are near the November 2023 FOMC Feds meeting. Most likely there will be good news and an emergence of a strong tailwind for the market after the meeting.
Impossible for the share price to drop to USD 24.41 on the 1-month support level.
Recommend a buy at USD142.23 level on technical Analysis perspective.
USD166.89 will be this week or next week bottom price. Might or might not breakout depending on the outcome of the FOMC Feds meeting.

Apple for Apples ($AAPL)Stalled at the 138.2 on the wave 3 of five. Aim for potential double top at 199 next after retrace www.tradingview.com