A mayor crash is due soon, T10y02y spread just trigger my entryA mayor crash is due soon, T10y02y spread just trigger my entry point. I will be opening a short position on SPY. A huge short position
T10Y2Y trade ideas

T10y2y suggesting a credit crunch I have been following the spread between these two yields for a while. It seems the trend is reversing and soon we could see it moving to the upside. Guppy emas confirming the close we are to that trend reversing. Unfortunately this conditions leads to pain to financial markets like in the past. And this follow an easing response by the Fed lowering rates. Gold might continue rising.

RECESSION PROABILITY SIGNIFICANTLY INCREASES JAN - JUN 202410Y/2Y Yield Spread & Unemployment Rate
Originally shared back in July 2023 (see below charts)
Its interesting to see that the yield curve is rising fast (up towards the 0 level)
We are reaching into dangerous recessionary territory. No guarantees, just a significantly increased probability.
Continuous jobless claims are reaching pre-recession warning levels in both time and volume. Meaning more and more people are becoming unemployed and remaining unemployed for longer. More info in links below.
The average interest rate pause timeframe is closing in fast at June 2024 also(Contained in Charts below also).
Its time to pay very close attention. The initial 6 months of this year
Stay safe out there
PUKA

T10Y2Y 3M chart: Plotted US recessions since 1980US recessions since 1980 plotted on the T10Y2Y 3M chart.
Orange circles indicate value on the curve and the Stoch RSI value at the start of the first month and year of recession.
Red vertical bars are length of recessions.
Orange vertical lines on the Stoch RSI are the first month and year of the start of the recession.
Good luck traders.

Still not a good time to short.Reminder, when the yield curve turns positive, that's your warning to get out of stocks. AMEX:SPY , SP:SPX , $^ES

Past SPX action after the 10y-2y yield inversion unwoundI made a chart to show past SPX action after the 10y-2y yield inversion unwound.
Dec 2000: SPX was already in bear market and continued down.
May 2007: SPX topped, then made a double top, then collapsed.
Aug 2019 (atypical): SPX made a +10% move, then collapsed.

10/2 Inverted Yield StrategyThe inverted Yield is basically 6/6 as an indicator of an oncoming recession. At initial inversion the stock market sees initial growth as rates go higher. It isn't until on average 16-19 months that a recession occurs after initial inversion.
www.putnam.com
A study by Bloomberg tracked performance of the S&P 500 against the 2 and 10 year US treasury inverted yield curve and found that the best time to sell equities in the stock market was when the inverted yield begins rising again and is at the -0.15 level. The best time to get back into the market and restart your DCA is when the inverted yield rose above the 2.15 level. This period typically takes 660-700 days to occur.
www.bloomberg.com
On April 1, 2022 the 2/10 yield curve inverted. As of today we are at 19 months.
Today October 20th, 2023 the inverted yield curve turned up at -0.15.
The vertical red lines are selling of equities at -0.15 and the green line indicated repurchasing of equities at the 2.15 line for the last two recessions.
*This is not financial advice. Invest at your own risk and do your own due diligence.

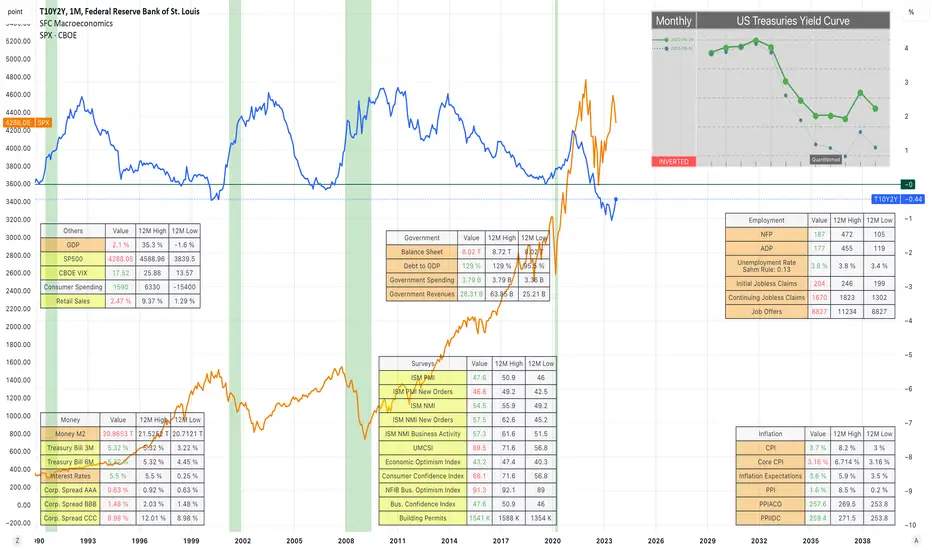
Qualitative Fundamental Analysis of US Economy Oct.2023The most important factor for the economy is the behaviour of GDP. Several economic indicators are tracked to determine the overall economic situation and GDP growth.
A technical recession is defined as 2 consecutive quarters of negative real GDP.
If GDP grows less than 3% on average for the year, the economy is not growing fast enough and this will lead to unemployment.
At its core, the Federal Reserve has dual mandate policy: price stability(2% inflation for a year) and maximum employment (max Unemployment rate 4%) .
CPI Inflation projection: inflation is forecast at 4.7% in 2023 and is expected to further slow down to 3.0% in 2024.
Actual CPI : 3.7 %
PCE Inflation projection: inflation to be 3.3 percent in 2023, 2.6 percent in 2024, and 2.2 percent in 2025, and the Federal Reserve expects a similar outlook of 3.3 percent, 2.5
Actual PCE : 3.5%
Unemployment rate projection: The unemployment rate reaches 4.1 percent by the end of 2023 and 4.7 percent by the end of 2024 before falling slightly, to 4.5 percent, in 2025.
Actual: 3,8%
GDP Growth projection: Real GDP increases by 1.5 percent in 2024 and by 2.4 percent in 2025.
Actual: 2,4%
Interest rates projection:The Fed now expects its benchmark federal funds rate to close out 2024 at an effective rate of 5.1%, which is higher than its June forecast of 4.6%
Interest rates: 5.5%
MONEY MARKET
Yields
From the chart above we can see when the recession is coming. The 10Y-2Y has already fallen below 0 and we should prepare for a recession when it comes above 0.
The yield curve (all yields) is slightly inverted, but only because of the 20-year yields. The overall curve is normal, which means that investors are not worried about the future, at least for now and they invest more in long-term bonds.
According to the FED, we should expect a mild recession at the end of this year.
The SP500 seems to be consolidating for the next few months.
Corporate Bonds and Credit Spread
Spreads are relatively stable. They do not point to a recession.
Money Supply M2
The money supply is also stable, which means that the printer is not running. This is a good sign considering the banking crisis.
interest rates
The last time IR was so high was during the last recession in 2008. History could repeat itself. At the last FOMC meeting, the FED paused rates but said they would remain high. This could be exactly what happened in 2007. FED paused after aggressive hike and recession came.
SERVEYS
ISM PMI, NMI
The historical correlation between real GDP growth and the ISM PMI/NMI is 85%. PMI/NMI are leading indicators and they will predict how GDP will move. It is a short to long term prediction (within 12 months).
The reading continued to point to another albeit smaller deterioration in the manufacturing performance, as contractions in output and new orders softened. Meanwhile, sufficient stocks of inputs and finished items, alongside still subdued demand, led firms to reduce their purchasing activity sharply again and firms continued to work through inventories in lieu of expanding their input buying, which contributed to a further improvement in supplier performance.
Consumer Sentiment Index(UMCSI)
The level of consumer confidence in stability and future prospects can be used to understand the overall trend in the economy.
Still, consumers are unsure about the trajectory of the economy given multiple sources of uncertainty, for example over the possible shutdown of the federal government and labor disputes in the auto industry.
From a technical perspective the chart looks very suspicious. Like bullback before the new swing. Will see.
Building Permits
The jump in permits suggested that new construction continues to thrive, driven by a shortage of homes available in the market, despite the dampening effect of rising mortgage rates on housing demand.
NFIB Business optimism index
Twenty-three percent of small business owners reported that inflation was their single most important business problem, up two points from last month. Also, the number of small business owners expecting better business conditions over the next six months declined (seven points from July to a net negative 37%). “With small business owners’ views about future sales growth and business conditions discouraging, owners want to hire and make money now from strong consumer spending,” said NFIB Chief Economist Bill Dunkelberg. “Inflation and the worker shortage continue to be the biggest obstacles for Main Street.
Overall the business is not optimistic for the near future.
Leading Economic Index
The Leading Economic Index provides an early indication of significant turning points in the business cycle and where the economy is heading in the near term.
The US LEI continues to signal a recession. Combined with the yield curves, it looks like a recession could be coming very soon.
INFLATION
Total Inflation = 30% CPI (demand) + 40% PCE(supply) + 30% other factors)
CPI
The FED's target may be 2%, but the reality is that inflation is between 2-4%. Inflation has risen again in recent months and current oil prices suggest that it will remain high.
Investors are worried about future prices. The same thing happened in the 80s. The FED does not want the same to happen today, which is why they have been so hawkish recently.
Core CPI
This projection is very scary, but if the economy goes crazy, it can happen, just like in the 80s. I am not predicting that core CPI will rise that much, just pointing out the similarity.
PCE Inflation
The US personal consumption expenditure price index rose 3.5% year-on-year in August 2023, the most in four months, after an upwardly revised 3.4% rise in July and in line with market expectations.
PPI / Core PPI
The producer price inflation in the United States accelerated to 1.6% year-on-year in August 2023. This is the second consecutive month.
GOVERNMENT
Balance sheet
The balance sheet is falling, which is deflationary. On the one hand, this is good and gives us an indication that inflation should be contained, but on the other hand, it is a sign of recession.
[b ]Cyclical Commodities
Trade weighted US Dollar Index
Rising trade indices are actually deflationary for the economy.
Commodities
They stable prices do not give us a clear picture of the near future.
Stocks
The benchmark indices are falling. The failed to make new HH, suggesting that the will consolidate or fall.
Sometimes they are seen as a leading indicator of future GDP and recession.
Summery
The current pause in interest rates, with the hawkish narrative that rates will stay high for a long time, could be the second phase of the business cycle. The next one is recession.
Yield curves have also suggested that the recession is not as far away as we think.
The surveys are relatively stable, but the overall picture is not so optimistic.
Inflation is on the rise again, which may lead the FED to be more aggressive. They have said many times that they would rather have a recession than a price explosion. They have even warned about a mild recession, how mild we will see.
The unemployment rate is still below 4%, but in recent months it has risen from 3.5% to 3.8%. Rising unemployment is a sign of recession.
Stock indices have risen in recent months, but future expectations of a new recession, combined with high interest rates and business optimism, are bearish factors for the stock market.
Finally Figured out how to make the 10Y-2Y yeild curve inversionLink: www.tradingview.com
your welcome! #WAGMI

Yield curve prediction for 2024I feel we have 107 days to ride the bull market starting next week, if govt. shutdown is not happening. Lets ride the bull. :)

Bitcoin Vs Recessions. We need more data. (sept2023)Bitcoin Vs Recessions. We need more recession data, Bitcoin has never existed during an official recession before (time of writing sept 2023) but we can use this chart to see future trends.. lets see how it works out!!!

2 yr 10 yr spread watch this its going to come in The chart posted is the 10/2 spread that everyone is watching >it bottomed see golden ratio

The Chart The FRED Does Not Want You To See - All Wrong.
Can't help but notice the incredible amount of people calling for recession this or no recession both on Bloomberg and CNBC using the 10Y -2Y without adjusting it for the money debasement?
Could not be more clearer almost all of these "market experts" still living in pre 2008 with their degrees are going to be absolutely obliterated buy the CPI and eventual return of inflation.
ADJ the 10Y -2Y to the M2 that includes the debasement of bail outs you can see the US bonds are in a spiral down and down. Why?
You can't get Japan to YCC bond yields with printed currency to prop up the market this leaves smart investors selling the bonds and the yield goes up.
The FRED on purpose has tried to create disinflation causing mass money to flow back into the US bonds to prop down the yield as the "experts want more return on inflation.
Sorry Japan is having an inflation crisis and they need to sell the US bonds, and China is selling too.
Now you get a failing US bond market that could be in a bear market on nominal value to inflation for the next decade.
"experts" purchasing high yielding bonds that cannot outrun US CPI yes you're going to lose.
"experts" longing instruments like TLT expecting mass cash to flow back into US bonds you're praying and hoping the FRED starts YCC or Japan sends their economy down the drain to save the US bond system.
We've been in a recession since 2009, reason these "experts" on tv don't notice this is due to them owning assets that benefit from monetary policy and fiscal debasement.
Bill Ackman has recently figured this out too taking a defensive position on this. Some are shorting bonds, some allocating to Gold, some allocating to Bitcoin.
Is Bill Ackman insane? or has he simply figured the FRED used fake data to try get the market to flee from markets causing deflation.
www.investing.com
2023 - We can't have a recession if we've been in one since 08.

Recession Timeframe Horizon Macro Monday (2)
Potential Recession Time Horizon
Below you will find a breakdown of how many months pass before a confirmed Economic Recession (shaded grey areas) after the yield curves first definitive turn back up towards the 0% level:
1) 13 Months (Dec 1978 – Jan 1980)
2) 9 Months (Nov 1980 – July 1981)
3) 16 Months (Mar 1989 – Jul 1990)
4) 12 Months (Mar 2000 – Mar 2001)
5) 22 Months (Feb 2006 – Dec 2007)
6) 6 Months (Aug 2019 – Mar 2020)
7) 4 Months so far (Mar 2023 - ????)
Average Time frame: 13 months (reasonable time horizon would be 6 – 18 months).
I consider the first definitive turn up towards the 0% level as no. 7 on the chart (March 2023). Since this date we have rolled over below the -1% level (see additional chart in comments). March 2023 appears similar to the bounce in Dec 1978 (No. 1 in the chart), it also rolled over to the lower sub -1% level. If we assumed a similar 13 month timeframe to recession commencement as in Dec 1978 of 13 months, which also aligns with our 13 month average above, we would be looking at April 2024 for a recession to commence. Interestingly 1978 - 1980 was a similar peak inflationary period known as the Great Inflation, a defining macroeconomic period of high inflation.
You might be wondering, has a recession ever occurred in the month of April before? I personally thought this was a strange month but it has occurred in the past.
In April 1960 a recession commenced and lasted 10 months to February 1961. The 1960 recession was mainly a result of an over-tight monetary policy whereby the Federal Reserve raised interest rates from 1.75% in mid-1958 to 4% by the end of 1959 and maintained them at that level until June 1960. The Federal Reserves motive for raising interest rates and maintaining them was fear of high inflation (as in early 1951 inflation soared to +9.5%). Is it just me or is this all starting to sound a little too familiar?
If we wanted to cater for all time scenarios in the chart and noted above (no. 1 - 6) we could argue that the start of a recession is possible at the earliest within 6 months (Sept 2023) and at the latest 22 months (Jan 2025). Also, the month of April 2024 has some eerie similarities to two prior recessions, the 1978 and 1960 Recessions.
Lucky 13
Since World War 2 bear markets have on average taken about 13 months to reach their bottom and a further 26 months to recover their losses. Our average time before a recession would start is 13 months. It’s worth remembering that it could take an additional 13 months before a bottom is established and then 2 years or 26 months (2 x 13) of price action below the pre-recession price highs. Over 3 years is a long time to wait to recover losses. It would be pertinent to start deleveraging or increasing your hedge from the 6 month mark (Sept 2023 in this case) as subsequently the likelihood of a 3 year period below the Sept 2023 price levels increase as each month passes. For reference the S&P 500 index has fallen an average of 33% during bear markets over the avg. timeframe of 13 months to the bottom.
I actually find it very hard to accept that a recession is possible in the near term (within 6 - 12 months) and I would in fact argue against it, however I cannot explain away the data in the chart which speaks for itself and warrants at least some consideration & caution. Nothing is a guarantee and maybe this time it will be different, especially factoring in the amount of unprecedented liquidity added to the market in recent years, sticky inflation and financial supports provided to systemically important banks.
All the chart really indicates is a probable window for a recession to start some time between Sept 2023 – Jan 2025 and no guarantees.
The rule of 13 is worth remembering, simply from a timing perspective (before and during a recession) as it may help your timing. Based on two similar periods in history, the 1978 and 1960 recessions suggest the month of April 2024 may be a key date. Again, no guarantees.
It is also worth noting that for the last six recessions, on average, the announcement of when a recession started was up to 8 months after the fact…meaning we will have no direct indication when a recession starts, however the un-inversion of the yield curve (back above the 0% level) and a rise in unemployment will be the early tells, so these are worth paying attention too. We will keep you posted on any sudden changes in these metrics.
I hope the chart is helpful, provides one perspective of which there are many, and can help time and frame the situation we currently find ourselves in. NO GAURANTEES, just probable timeframes that may be worth paying attention too.
PUKA
List of Recessions:
1. COVID-19 Recession (February - April 2020)
2. The Great Recession of 2008 (December 2007 - June 2009)
3. The September 11 Recession (March - November 2001)
4. The Gulf War Recession (July 1990 - March 1991)
5. The Iran/Energy Crisis Recession (July 1981 - November 1982)
6. The Energy Crisis Recession (January - July 1980)
7. The Nixon Recession (December 1969 - November 1970)
8. The “Rolling Adjustment” Recession (April 1960 - February 1961)
9. The Eisenhower Recession (August 1957 - April 1958)
10. The Post-Korean War Recession (July 1953 - May 1954)

Recession Indicator 29/6/23This is a recession indicator, looking at the ten year % minus the two year %

is the 2y10y signaling the beginning of the end?Chart is self explanatory are we about to go Kaboom?

10's-2's will be resolved next week. How?Could be 10 yr moves higher and the stock market takes a dive.


T10-2Y Treasury Yield - Monthly ChartI tried to predict Treasury yield cycle using Trent lines.
I would like to see if the treasury yield follow the cycle along the trend lines.

2022-10-17 2y10y spreadArgument for being long, statistically, previous recessions bottomed at these levels


Qualitative Fundamental Analysis of US Economy Sep.2022Most important factor for the economy is how GPD behaves. Several economic indicators will be observed, in order to obtain the whole economical situation and GDP growth.
Technical Recession is defined when Real GDP has 2 negative consecutive quarters.
2022,Q1: -1,6 %
2022,Q2: -0,6 %
2022,Q3:
2022,Q4:
Inflation target: 2%
Actual: 8,3 %
Unemployment rate target: 3,7-4%
Actual: 3,7%
GDP Growth target:
Actual:
Yields
From the chart above can be seen that Yield Curve 10-2 is going down and most importantly - the curve is already below zero. Last time, when the curve reached this level was back in 2000 and 1 year later the "The great Recession" happened.
We can also seen that the 10Y Yields and 2Y Yields are going high, which is deflationary for the economy. The 2Y Yields already crossed up 10Y Yields and this means that investors are worried about the future economy situation.
Yield Curve(all Yields) is inverted. This happens if the economy shrink or is going to contract.
Since Jan.2022 the Yields are going high, but the Stock market and GDP are going down. At this moment there is no perspective for changes
Corporate Bonds and Credit Spread
There is a strong correlation between the spread and GDP. Spread go up - GDP contract.
Money Supply M2
M2 is most important measure of money supply and is used as injection and withdraw to control inflation, growth and value of the currency.
From the chart above we can see that in 2020 when there was the Covid crisis, the FED aggressively printed more money to avoid recession. But this time the inflation is too high and they can not print more money. This means that they can not inject money in the economy and it will deflate.
Interest rates (FED Fund Rates)
Last two crisis (2008 and 2020) the FED actually reduced the Interest Rates in order to fight with the recession. This time they could not do it, because the rates were already 0 %. In order to fight with the inflation they will increase the rates and this move will make the economy to shrink more.
ISM PMI, NMI
In Mar. 2021 the indexes peaked and since then they go down. These indexes are leading indicators about GDP growth. Right now they are above 50 level, but when they fall below 50 and then GDP will definitely contract a lot.
Consumer Sentiment Index(UMCSI)
The level of confidence that consumers have about the stability and future prospects can be used to understand the overall trend of the economy.
As we can see there is no confidence about the future prospects - not at all.
From this indicator we can suggest that the economy will shrink.
Building Permits
It seems that the Permits already peaked at dec.2021 and now are going down.
Developers are bearish on the prospects of the future home sales.
This indicator lead us, that GDP will contract.
NFIB Business Optimism Index
It seems that business are not optimistic about the future, so they will not hire people and not make new investments. Very soon the index will fall below 90 level and this will be very strong indication about the economy contraction.
Trade weighted USD Index
Generally the rising index is deflationary for the Cyclical commodities. Which are very good indicator about future Inflation.
Cyclical Commodities
It seems that some commodities like copper, Crude Oil, Lumber, Iron already peaked and started to fall.
The logic here is, when the commodities prices are going down, the inflation should go down too.
CPI/ Core CPI
We know that current inflation is much more then the FED target of 2%.
Increasing the Interest Rates make dollar more attractive for the investors, thats why all USD Indexes are going up, which makes commodities prices to go down.
If we consider all these facts, we can predict that inflation will go down in future in future.
PPI/ Core PPI
It seems that PPI indexes already peaked and now are going down.
Employment Situation Report
The future expectations about economy are negative, this will lead the unemployment to grow, exactly as 2020 or may be more.
Future deflation and unemployment growth will shrink the economy and GDP will go down.
Balance Sheet , Debt, Deficit
In Covid crisis, when GDP went down the FED printed more money, which increased the Balance Sheet and Debt. The big debt brought more deficit for USA.
Higher debt means more pressure to inflate. The only choices are to deflate, default on debt or inflate further.
In 2020 the debt was above 100% and the Government chose to inflate more and avoid recession. The debt rose to around 140%. Levels above 100% are very critical, the debt was never bigger then now.
In this case I believe the Government will chose to deflate and GDP will fall.
SUMMERY
The economy is technically in recession and all economical indicators shows, that the deflation just started and GDP will go down for a while.
Historically the FED just printed more money, inflate more and avoid a long period of GDP contraction or even recession. Right now the inflation is out of control and the hawkish FED already announced, that the priority is to bring the inflation back to normal, by increasing the Interest Rates.
This aggressive move will make GDP to contract further and economy to shrink further.
Indicator --Economy, GDP--Commenter
Yields--contraction--Increasing the IR will move the Yields higher, 2Y Yields will increase rapidly
Credit Spread--contraction--The spread, already started to go high
M2 Money Supply---contraction---It seems that this time will be no injection, but withdraws.
FED Fund Rates---contraction---The FED are very hawkish, that will increase the rates, no matter what.
S&P 500 VIX Index -------------- not observed
ISM PMI/NMI--- contraction---Already peaked. New orders predict PMI will go down further
UMCSI---contraction---It is below 50 level, which is very bearish
Building Permits---contraction---Near the peak level, may be already peaked.
NFIB Business optimism index---contraction---Already reached level 90, below this level it is very bearish.
Trade weighted US Dollar Index---deflation---Rising Dollar Index will deflate the Commodities.
Cyclical Commodities---deflation---For now prices are going down.
CPI/ Core CPI---deflation---It seems that Inflation peaked, Commodities are going down, IR are going up .
PPI---deflation---Same as CPI.
Employment--- deflation---If economy shrink, unemployment will rise, may be to the levels of 2020.
Debt/Deficit/Balance sheet---deflation---Debt is already above the critical level (100%), probably the the Government will deflate this time.
Stock market ---contraction---Stock market is leading indicator for GDP, since Jan.2020 stocks are falling.

10-2 Curve Yield Inversion is foreshadowing recession AMEX:SPY FRED:T10Y2Y Here is my DD on why I think we will officially enter recession early 2023. Current situation is identical to 2000 tech bubble.
Back then 10-2 curve yield inversion dropped to its lowest around Spring-Summer 2000. Then the official recession started Spring 2001. Market didn’t fully bottom until end of 2002/early 2003.
Fast forward to 2022, we’ve just reached the lowest 10-2 curve yield inversion since 2000. Meaning a few months from now we will officially be in recession, either end of 2022 or early 2023. Which I suspect could last until early 2024. Since U.S election is scheduled for Fall 2024, Fed and politicians will have to prop the economy back up so they can use “economy recovering” for voting narratives which is what can trigger the next real bull trend.
Conclusion: curve yield inversion has always been indicative of an upcoming recession, so the real bear market hasn’t even really begun yet. What we recently experience was most likely just a warmup👀
