BNBUSDT IDEAHello Traders Hope You Are Enjoying Our Analysis. Today We Will Discuss About BNB
(Analysis)
The Ascending Triangle Has Confirmed Breakout On 1D Timeframe☑️
Expecting Massive Bullish Wave✍️
BNBUSDT trade ideas

BNBUSDT: Bullish Flag (Bullish Trend) 🚀 Exciting Trading Opportunity Unfolding! 📈 BNBUSDT.P on the 1-hour chart reveals a meticulously identified Bullish Flag pattern, signaling a potential breakout for lucrative gains! 🌐 Join us as we navigate this promising setup, anticipating a decisive uptrend. 📊 No bearish divergence or trend in sight – the stage is set for a bullish surge! 📢 Traders, seize the moment strategically, position yourselves for maximum advantage, and stay alert for the breakout signal. 📈🚀 Let's ride this wave together! 🌊 #BNBUSDT #BullishFlag #TradingOpportunity #Crypto

#BNB BREAKOUT THIS BULLISH PENNANT PATTERN!#BNB retests the bullish pennant pattern. If we successfully retest this pattern, then we can expect a good bounce.
#Crypto

BNB looks bullishConsidering the HLs on the chart and the bullish mCH on the chart and the breaking of the trigger line, we can have a bullish view on BNB.
If there is a pullback on the green range, we will look for buy/long positions.
The target is clear on the chart
Closing a daily candle above the invalidation level will violate the analysis
For risk management, please don't forget stop loss and capital management
When we reach the first target, save some profit and then change the stop to entry
Comment if you have any questions
Thank You

BNB(BINANCE COIN) is ready to go up
* 1D
BNB seems to be undergoing ascending triangles and triangular convergence.
It's currently attempting to break through the downtrend line at the top of the Ascending triangle and should be supported for further upside.
I think it's about to break through.
Let's see

BNB Bulls Charge Ahead: Uptrend Signals and Price OptimismBinance Coin (BNB), the native token of the Binance ecosystem, is currently displaying bullish signals across technical charts. This positive trend suggests a potential continuation of price growth shortly.
Cruising Above the 100-Day SMA:
One key indicator of BNB's bullish momentum is its position above the 100-day Simple Moving Average (SMA) on the 4-hour timeframe. The SMA represents the average price of an asset over a specific period, and the 100-day SMA acts as a line of support, indicating the overall trend direction. With BNB trading consistently above this level, it suggests a sustained uptrend and buyer dominance in the market.
Breaking Out of Consolidation:
Further bolstering the bullish case is BNB's recent breakout from a consolidation zone. Consolidation periods typically occur after significant price movements, and a breakout from this zone signifies a potential resumption of the previous trend. In BNB's case, the breakout suggests a continuation of the upward trajectory, potentially leading to new highs.
Rising Momentum on the 4-Hour Chart:
The 4-hour chart provides valuable insight into short-term price movements. In BNB's case, the 4-hour chart reveals strong rising momentum, characterized by a series of higher highs and higher lows. This momentum indicates that buyers are actively pushing the price upwards, further strengthening the bullish outlook.
Surpassing the $700 Threshold:
A significant psychological milestone for BNB was its recent climb above the $700 mark. This price point can act as a level of resistance, where sellers may attempt to cap further gains. However, BNB successfully breaching this resistance suggests a robust market recovery and increased investor confidence.
Investor Optimism on the Rise:
The technical indicators and price movements all point towards a growing sense of optimism among investors and traders. The positive momentum surrounding BNB is likely fueled by several factors, including:
• Binance's strong brand reputation: Binance is one of the largest and most respected cryptocurrency exchanges globally. Its success can contribute to increased demand for BNB.
• Expanding utility of BNB: BNB's utility extends beyond simply being a trading token. It can be used for various purposes within the Binance ecosystem, such as paying fees, participating in token sales (IEOs), and obtaining discounts on trading fees. This growing utility can drive demand for BNB.
• Overall market recovery: The broader cryptocurrency market has shown signs of recovery in recent weeks. Positive sentiment in the overall market can have a spillover effect on individual tokens like BNB.
What to Watch Out For:
While the current outlook for BNB is positive, there are always potential risks to consider:
• Market Volatility: The cryptocurrency market remains inherently volatile. Sudden shifts in sentiment or broader economic factors can lead to sharp price corrections.
• Regulatory landscape: Regulatory uncertainty surrounding cryptocurrencies can dampen investor enthusiasm and impact prices.
• Technical corrections: Even within an uptrend, there can be periods of price consolidation or pullbacks. These corrections are healthy for the market but can be misinterpreted by short-term traders.
Conclusion:
BNB's technical indicators and recent price action paint a bullish picture. Trading above the 100-day SMA, breaking out of consolidation, and surpassing the $700 mark all suggest a potential continuation of the uptrend. Investor optimism surrounding BNB and the broader market recovery further reinforce this positive outlook. However, it is crucial to remain aware of potential risks associated with the volatile cryptocurrency market. By carefully analyzing technical indicators, staying informed about market developments, and implementing sound risk management strategies, investors can potentially capitalize on the opportunities presented by BNB's current bullish momentum.

BNBUSDT BULLISH BREAKOUT 💰 CRYPTOCAP:BNB is trying to fix above the Monthly Supply Zone💁♂️
Even if it's a correction case I am not looking for #BNB to go below Monthly Supply Zone
📈Our Mid-Term Target: 908$
BINANCE:BNBUSDT
LEAVE LIKE AND COMMENT FOR SUCH MORE UPDATE ☺
#CRYTOEASE

BNB - New high on the horizon?The Elliott Wave count, coupled to the oscillators suggests we're finishing (finished?) a wave (iv), meaning, we're again going for a new high before a more consequent correction follows.

Bnb analysis Bnb usdt analysis
Binance
Time frame daily
Bnb escaped from yellow triangle
Price came down to edge of triangle and started to pump to my first target 950$

BNB long term chart to 5 or 10k this cycle or 100k on next BNB has broken out of resistance
BNB in long term log channel
If BNB moves as per last period just after covid Mar 20 until May 21 it projects up to 5k to reach the upper part of the channel.
This is a 10X move which happens in crypto
BNB and Coinbase are major payers in a relatively new market its normal for early established players to capture the lions share of the market.
BNB can earn a lot of money from its dealings in Crypto as a market maker especially if transactions increase as more assets are tokenised and crypto become more mainstream.
BNB can 'square the range' its been trapped in a range - a target for breakout of the range is just to double the range. BNB may step up a couple of times using these range bound limits

Long BNBUSDT, 8HLong BNBUSDT, 8H
entry 589.0 - 575.9
sl 536.7
tp scalp 641.3
tp1 691.8 (ath) - 715.3
tp2 798.2
move sl to entry after price reach 641.3 ; price shouldn't retest entry again.
BINANCE:BNBUSDT BINANCE:BNBUSDT.P BINANCE:BNBUSD

How many percent can BNB currency grow?BNB currency has a record of 800% and 10,000% growth in the upward movement

BNBUSDT.1DAnalyzing the daily chart for Binance Coin (BNB) against USDT, we observe a significant price consolidation over the recent months. As of the latest data point, BNB is trading at $629.7. The chart is marked with several key resistance (R1, R2) and support (S1, S2, S3) levels.
Resistance Levels: R1 at $649.1 and R2 at $724.8. These levels have served as strong psychological barriers where price has faced selling pressure. The break above R1 recently suggests a bullish sentiment that may attempt to test the R2 level if this momentum continues.
Support Levels: S1 at $498.2, S2 at $398.5, and S3 below that which isn't clearly shown in the chart. The support levels indicate where buying interest has historically been strong enough to prevent further declines. Notably, the price hasn't tested S1 recently, indicating current market strength.
Technical Indicators:
RSI (Relative Strength Index) is at 56, which is moderately bullish and suggests there's room for upward movement before the asset becomes overbought.
MACD (Moving Average Convergence Divergence) is showing a bullish crossover, which supports the upward price momentum observed.
Price Action: The presence of bullish candlesticks breaking above R1, coupled with increasing trade volume, indicates an accumulation phase possibly by institutional investors, signaling strength.
Conclusion: The technical analysis suggests a bullish outlook for BNB in the short term, provided it sustains above R1. Traders might look for entry points on small retracements towards R1, setting stop losses just below this level to manage risk. The next target would be R2, with a possible breakout leading to higher highs. However, any reversal and break below R1 would require reevaluating this bullish scenario. Always consider market news and broader economic indicators which might influence market sentiment and cause sudden shifts in price trends.

BNB/USDT - 4H - Long My point of view:
1. Strong up trend
2. Up trend volumen zone
3. Correction area
4. 15% down price slide.
Risk/reward = 2.68
IMO worth it.

BNB/USDT 1HInterval Chart ReviewHello everyone, let's take a look at the BNB to USDT chart considering the one hour time frame. As we can see, the price is approaching the point of exiting the triangle, after the current recovery.
Let's start by determining the support line, as we can see, the price is based on a significant support at the level of $672, in case of breaking the support, the next support is $656, and then a very strong support at the level of $632.
Looking the other way, you can see the resistance at the price of $682, then there is a point at the price of $696, the third resistance is significant and has doubled the price increase at the level of $720, further resistance can be identified at the price of $736.
When we look at the RSi indicator, we will see that the energy is approaching the lower limit. We have a similar situation on the STOCH indicator, but here we are bouncing off the bottom of the mark, which slows down the decline.

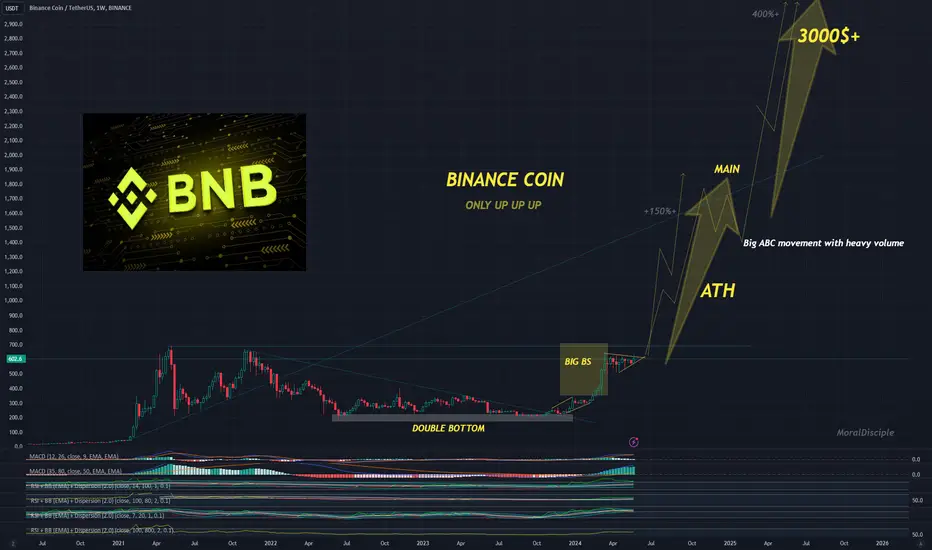
#BNB hits new all-time high📊#BNB hits new all-time high💥
🧠From a structural perspective, we successfully broke through the neckline and hit a new all-time high. This means that higher space has been opened at the monthly level, and the ideal target area can be seen at 1379-1804. Therefore, the BNB we hold in the buy zone below can choose to continue to hold it. 💪
➡️From the weekly level, we have continued the bullish trend according to the double bottom bullish structure. Currently, the ideal target area of this structure has been achieved, so there is an expectation of a callback in the mid-term. If your entry point is not ideal, you can choose It makes sense to lock in major profits or close positions. ✔️
🔥New participation opportunities can focus on the main support area 495-536🔥
🤜If you like my analysis, please like 💖and share it💬
💕 Follow me so you don't miss out on any signals and analyze 💯
BINANCE:BNBUSDT

BNB 1000$ soon ALL trading ideas have entry point + stop loss + take profit + Risk level.
hello Traders, here is the full analysis for this pair, let me know in the comment section below if you have any questions, the entry will be taken only if all rules of the strategies will be satisfied. I suggest you keep this pair on your watchlist and see if the rules of your strategy are satisfied. Please also refer to the Important Risk Notice linked below.
Disclaimer


BNB forming resistanceGreetings! there is a resistance forming between 704 and the highest value registered this week. In case of consolidation, this levels could trigger a retracement to the lower levels depicted in red. There is an interesting range formed from 637 to 622 in which buy limit orders could be placed in case that the price gets a rejection here. This forecast gets invalidated if the price breaks the current HH. Also the accumulation range depicted here from 620 to 598 is going to be useful later in case that the price breaks down below 632.

$BNBUSDT-Formed Symmetrical TriangleDear Traders,
We are convening a discussion focused on #BNBUSDT
The Symmetrical Triangle Pattern is Formed
In Case of Successful Breakout, Expecting a Bullish Move of 20% 🚀
Regards: AnnaTradeCharts
#Bitcoin #Crypto #Ethereum #Cryptocurrency #CryptoTrading #BTCUSDT #ETHUSDT #ALTCONS #USDT CRYPTOCAP:BTC CRYPTOCAP:ETH CRYPTOCAP:USDT CRYPTOCAP:PEPE CRYPTOCAP:DOGE NASDAQ:ALT

A powerful crypto exchange that just started. UPDATEEverything is pumping and rising soon, US500, EURUSD, GOLD, BITCOIN ETC
It is a coin of a major crypto exchange and definitely a good choice. The crypto industry is in its infancy
Only up!
BNB Bulls Eye Breakout: Will Binance Coin (BNB) Surge Past $660?Binance Coin (BNB) has emerged as a standout performer, showcasing significant price movements over the past few years. From its early days at around $50 in November 2020 , BNB has experienced dramatic highs, bringing significant opportunities for investors.
BNB's journey has been nothing short of remarkable. After climbing to an impressive $696 peak in May 2021 , the subsequent bearish market took its toll, driving the price down to a low of $200 in June 2022 . The coin then faced a resistance level of $340 , appearing as a double top pattern before retracing back to the yearly support of $200 by October 2023.
However, the tide turned in favor of BNB as the broader crypto market regained momentum. The resurgence propelled BNB to new heights, surging to an all-time high of $640 . Currently, BNB has found solid support at the $500 level, a critical juncture that could pave the way for further upward movement.
I am closely monitoring BNB's recent price action, particularly as it hovers around the $590 resistance zone . A breakout above this level could set the stage for a significant rally towards the next resistance point at $620 . If BNB manages to breach this barrier, experts anticipate a clear path towards surpassing its previous all-time high to a new price $700 and potentially even higher.
Looking at the weekly timeframe chart, the $500 support level holds key significance. Should this level remain intact, market sentiment suggests a bullish breakout scenario, targeting ambitious price goals beyond the current resistance.
Investors and traders are advised to keep a close watch on BNB's performance in the coming days, as market dynamics continue to shift rapidly. With the broader crypto market showing signs of upward momentum, Binance Coin stands poised for a potential breakout, setting the stage for an exciting period of price discovery and market activity.
As always, it's crucial for participants in the crypto space to exercise caution and conduct thorough research before making investment decisions. The inherent volatility of cryptocurrencies underscores the importance of staying informed and adapting to evolving market conditions.

BNB detailed analysis ⏰ detailed chart 📉📈My analysis on BINANCE:BNBUSD
Detailed chart 📉📈 provided
Every move I will update under this post 🤠
Make shure saved / follow updates on my post of BINANCE:BNBUSDT
Just boosting 🚀 give support 📌
Soon i will update complete idea 💡
🧵 👉
