SWING IDEA - SYMPHONYSuccessfully retested support @ 872
Ready to go all the way till 1100 in the coming weeks

MSFT Possible buy ideaMicrosoft, technology services giant, is making a perfect long entry possibility on its weekly chart.
What to have on mind when watching the stock:
1. On Daily time frame, we had a perfect 50EMA retest. Stock managed to retake it and to even break above the smaller moving averages, the 10 and 21EMA.
2. This time frame is giving us a broad stop loss opportunity, once we enter the stock. To be precise, once the break of previous highs happen, my stop loss will be around the Daily 50EMA level, which is around $416.5 at the moment.
3. Back to weekly time frame and our entry point, my first entry would be once the price enters the Weekly channel, or it's previous high zone, sitting at around $430 price level. I will be monitoring the price and trading volume once this happens, I would like to see larger than usual trading volume.
4. My second entry and adding to the position, of course, if the break happens, will occur once the price crosses the $435.7 price level, which is just above the highest point on which the price of MSFT went.
Of course, this is just my opinion. I will try to give my best to update the idea as it develops. Thanks for liking and following me!

SYSWe can attempt to buy SYS from specified level if it gives breakout of LH , also bullish divergence occur indicate that it move upward.
SL , TP mention in chart.

Fidelity National launches climate risk assessment modelFidelity National Information Services Inc., a renowned financial services and outsourcing solutions provider, recently unveiled a new product to address climate risk assessment. As businesses grapple with the increasing uncertainty brought about by global climate change, Fidelity is positioning itself as a key player in the market for analytical tools.
Fidelity National’s newly introduced service, named the Climate Risk Financial Modeler, operates on a Software-as-a-Service (SaaS) subscription basis and is designed to assess risks associated with the physical assets of businesses and non-profit organisations. This tool is tailored for financial professionals seeking innovative methods to manage risk throughout the economic lifecycle.
Exploring potential trading opportunities, let’s review the technical analysis of Fidelity National Information Services Inc. (NYSE: FIS):
On the Daily (D1) timeframe, the stock has established a resistance level at 78.55 USD and support at 73.40 USD. The stock has been in an uptrend since the end of October 2023. If a downtrend begins, a potential downside target might be set at 60.10 USD.
However, if the current uptrend maintains its momentum and the stock price surpasses the resistance at 78.55 USD, there could be an opportunity to buy with a short-term target of 85.15 USD. For a medium-term investment strategy, the stock price might rise to 94.00 USD if the positive momentum continues.
__
Ideas and other content presented on this page should not be considered as guidance for trading or an investment advice. RoboMarkets bears no responsibility for trading results based on trading opinions described in these analytical reviews.
The material presented and the information contained herein is for information purposes only and in no way should be considered as the provision of investment advice for the purposes of Investment Firms Law L. 87(I)/2017 of the Republic of Cyprus or any other form of personal advice or recommendation, which relates to certain types of transactions with certain types of financial instruments.
Risk Warning: CFDs are complex instruments and come with a high risk of losing money rapidly due to leverage. 69.88% of retail investor accounts lose money when trading CFDs with this provider. You should consider whether you understand how CFDs work and whether you can afford to take the high risk of losing your money.

DIVISLAB - CUP AND HANDLEClose above 4100 would induce life into the Cup & Handle pattern and let the stock surge.
Has the potential for 25% run up from the current level

Jai Corp simple dow theoryWeekly chart
after long term consolidation
now recent resistance 330 once cross
upside target will be open

GME is moving again?What should I do with GME? I thought the movie was pretty good. I think there is room to the upside for short term gain. I'm not convinced on a long term position. That's how I feel at the moment. The landscape is always changing. I'm not in a position yet. I am itching to get in one though.

Bata india Can start for Reverse For upside Bata india Can start for Reverse For upside possible target 1500-1600-1700-1800+++ invalid 1248 cmp. 1404 Buy sustain above 1407

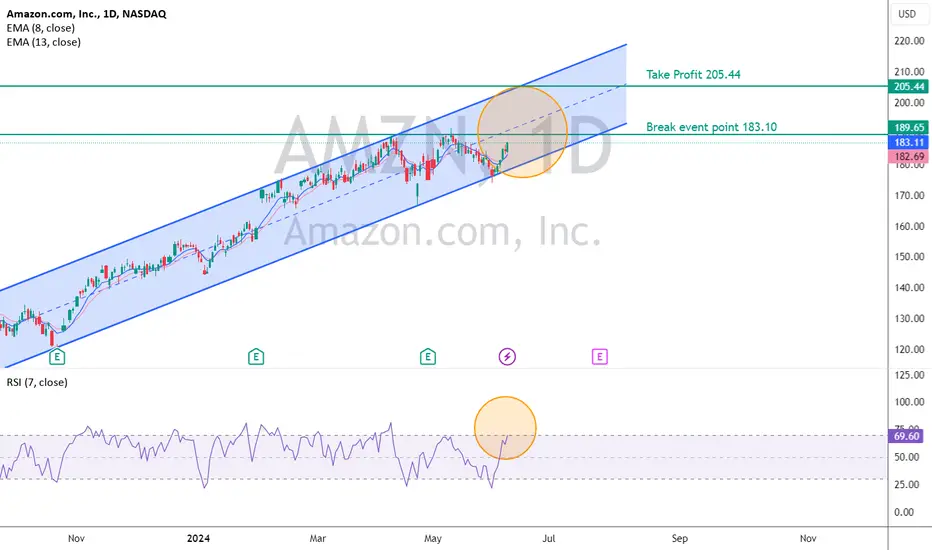
Resistance break event pointAccording to the idea of AMZN stock, the direction of the stock is upward, which can be analyzed from the perspective shown in the image to enter for profit at the Take Profit point.
"Investors should understand the nature of the product, return conditions, and risks before making investment decisions."
KEL | Next Support!KEL is facing selling pressure and can test its support level of 4. If the selling pressure resumes and the buyer gets active then a possible pull back is expected towards the trend line resistance around 5.50.

Are we ready for take off? Entry above 176This stock is showing a sign of strenght after long period of decline. I´m suggesting to enter long when the first 4H candle close above 176 and target 186 as a first step (partial close and set SL to BE) and then final target around 218. Don´t enter earlier, because I think stock market will pullback at the beginning of next week. Wish you good luck.

Wockhardt moved above the downward sloping trend lineWockhardt moved above the downward sloping trend line. RSI reading is strong. Can be interesting when the price comes down for testing the breakout

TCS - THE MIGHT IS RISINGIT has multiple technical confluence
1- INV H&S
2- CUP & HANDLE
3- POLE & FLAG
high time to look into TCS

NBCC - A clear go longEarlier suggested to go go long on the pre pole result day on dip. It respected our level.
Today on 11 June its a break out again.
Go long confidently for Targets depicted on the chart

DIAMONDYD 8R Trade set up1. Trend: Bullish
2. Set up: Reversal
3. RR: 1:8+
4. Perfect reversal from the support trend line.
5. Big rounding bottom breakout is expected this time and 166% TP may get hit

DMART - Momentum is building for upside move - Time to go LONG!DMart looks like it has bottomed out, presenting an opportunity for a long trade with a tight stop loss in place!
Trade Idea Explanation:
- Entry Point: Best around 4300+
- Stop Loss: Tight SL to 4100 on closing basis of D tf candle
- **Target:** Expecting a significant upside around 5900++
Stay updated for further insights and trade safely!
If you have liked the analysis, don't forget to leave a comment and boost the post. Happy trading!
Disclaimer: This is NOT a buy/sell recomendation. This post is meant for learning purposes only. Please, do you due diligence before investing.
Thanks & Regards,
Anubrata Ray

HOME FIRST - Best case!The chart is self-explanatory as always :)
⚠️Disclaimer: We are not registered advisors. The views expressed here are merely personal opinions. Irrespective of the language used, Nothing mentioned here should be considered as advice or recommendation. Please consult with your financial advisors before making any investment decisions. Like everybody else, we too can be wrong at times ✌🏻

OTLY H&SFor OTLY I believe a continuation head and shoulders is forming with a neckline around 1.30, above this level I believe a resumption of the positive trend

SMCI SupportOur liquidity sweep indicator gave a bullish signal on SMCI this morning. Daily support was swept and reclaimed, and lower time frame market structure has started to shift bullish here.

$TSLA GOODBYE :( $150? Lower Lows?We will find out. 10D chart suggests either a huge pop or ... a huge dump to fill that lonesome wick with a full sized body of a red candle. Good Luck my friends

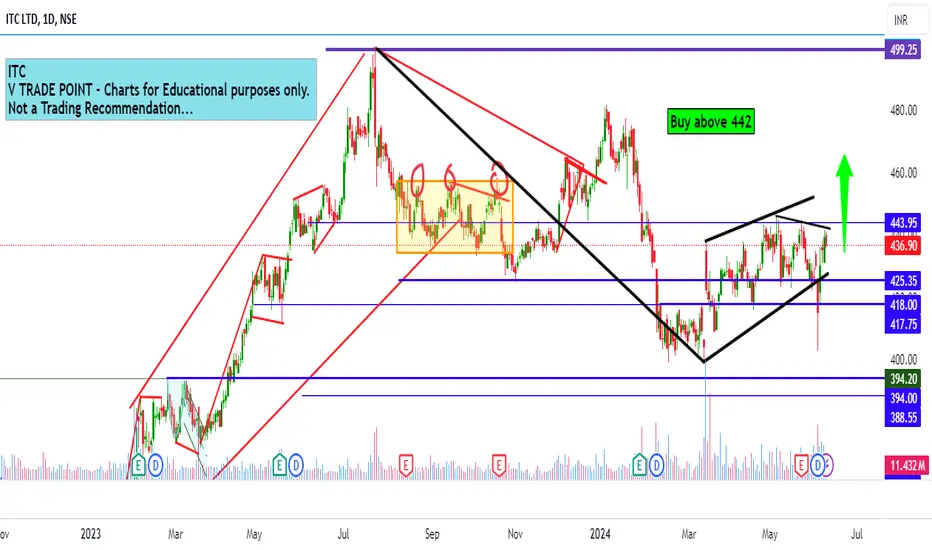
ITC LTD Intraday level for today 11th June 2024ITC LTD Intraday level for today 11th June 2024 #ITC
Buying opportunity above 442
Stop Loss area 438
Charts for Educational purposes only.
Please follow strict stop loss and risk reward if you follow the level.
Thanks,
V Trade Point
Sunteck RealtyInverted Head & Shoulder breakout happening. Current candle has not closed yet. Daily RSI approaching overbought levels.
Disclaimer : Intended for educational purpose only and it's not a buy or sell recommendation.

TransoceanI’ve been in and out of this over the years. I believe the next move is towards the top of the bearish Fibonacci channel, and then higher. The stock price has been consolidating nicely, without any major pullbacks, and apparent support in the fibs. Up
