
WHC, 2nd Wave is coming! heaven is calling.Trend has reversed, 2nd wave is coming....
1st Target: $8.61
2nd target: $9.29

AWC Nicely breakout! Trending strong!!if you follow this stock. its getting better and better.
it might break out $2........ (hopefully it will)
It returns like Victory shape.
AWC is such raising star that shines..
Go team A W C.

AUB - 10 months ASCENDING TRIANGLE══════════════════════════════
Since 2014, my markets approach is to spot
trading opportunities based solely on the
development of
CLASSICAL CHART PATTERNS
🤝Let’s learn and grow together 🤝
══════════════════════════════
Hello Traders ✌
After a careful consideration I came to the conclusion that:
- it is crucial to be quick in alerting you with all the opportunities I spot and often I don't post a good pattern because I don't have the opportunity to write down a proper didactical comment;
- since my parameters to identify a Classical Pattern and its scenario are very well defined, many of my comments were and would be redundant;
- the information that I think is important is very simple and can easily be understood just by looking at charts;
For these reasons and hoping to give you a better help, I decided to write comments only when something very specific or interesting shows up, otherwise all the information is shown on the chart.
Thank you all for your support
🔎🔎🔎 ALWAYS REMEMBER
"A pattern IS NOT a Pattern until the breakout is completed. Before that moment it is just a bunch of colorful candlesticks on a chart of your watchlist"
═════════════════════════════
⚠ DISCLAIMER ⚠
The content is The Art Of Charting's personal opinion and it is posted purely for educational purpose and therefore it must not be taken as a direct or indirect investing recommendations or advices. Any action taken upon these information is at your own risk.

ASX LIMITED: 10 June, 2024© Master of Elliott Wave Analysis: Hua (Shane) Cuong, CEWA-M
Details: The shorter-term outlook shows that since the low at 61.36, wave 2-grey appears to have ended, and this allows wave 3-grey to unfold to push higher. Wave (i)-orange is unfolding and is fulfilling its role, following which wave (ii)-orange will unfold as ABC. We will be watching ASX LIMITED for a Long Trade Setup.
Invalidation point: 61.36

ASX - NAB: 7 June, 2024© Master of Elliott Wave Analysis: Hua (Shane) Cuong, CEWA-M
The short-term outlook shows that wave ((iv))-navy ended earlier than expected, and wave ((v))-navy opened to push higher, it is subdividing into wave (i),( ii)-orange, and they have concluded, now it is time for wave (iii)-orange to open and push higher.
Invalidation point: 33.30

Bullish potential detected for KSNDetected 31-May (detailed commentary and full scan results available in the signature below). Not activated as at time of review of 31-May.
ASX:KSN represents a potential bullish opportunity should momentum continue and newer highs be made.
Entry conditions:
(i) higher share price with a decent test of long-standing resistance area of $0.087 from September 2023, along with swing up of indicators such as DMI/RSI.
Stop loss for the trade would be:
(i) below the support level from the low of 5th April (i.e.: below $0.082), or
(i) below the support level from the low of 30th May (i.e.: below $0.079), or
(i) below the support level from the low of 15th May (i.e.: below $0.075), depending on risk tolerance.

Potential outside week and bearish potential for SEKDetected 24-May (detailed commentary and full scan results available in the signature below). Not activated as at time of review of 24-May.
ASX:SEK represents a potential bearish opportunity should momentum continue and newer lows be made.
Entry conditions:
(i) lower share price below the level of the potential outside week noted on 24-May.
Stop loss for the trade would be:
(i) above the swing high of 22nd May (i.e.: above $23.60), once trade activated.

Bearish potential detected for CRNDetected 17-May (detailed commentary and full scan results available in the signature below). Not activated as at time of review of 17-May.
ASX:CRN represents a potential bearish opportunity should momentum continue and newer lows be made past the current position.
Stop loss for the trade (based upon the Darvas box formation) would be:
(i) above the top of the Darvas box formation from the high of 9th May (i.e.: above $1.17).

Bullish potential detected for QUBDetected 17-May (detailed commentary and full scan results available in the signature below). Not activated as at time of review of 17-May.
ASX:QUB represents a potential bullish opportunity should momentum continue and newer highs be made.
Entry conditions:
(i) breach of the upper confines of the Darvas box formation - i.e.: above high of $3.68 of 15th May (most conservative entry), or
(ii) swing up of indicators such as DMI/RSI along with a test of prior level of $3.62 from 9th May.
Stop loss for the trade (based upon the Darvas box formation) would be:
(i) below the support level from the low of 17th May (i.e.: below $3.52).

Bullish potential detected for JMSDetected 10-May (detailed commentary and full scan results available in the signature below). Not activated as at time of review of 10-May.
ASX:JMS represents a potential bullish opportunity should momentum continue and newer highs be made.
Entry conditions:
(i) higher share price along with swing up of indicators such as DMI/RSI.
Stop loss for the trade would be:
(i) below the support level from the low of 30th April (i.e.: below $0.31), or
(i) below the support level from the low of 6th May (i.e.: below $0.285), or
(i) below the support level from the low of 16th April (i.e.: below $0.27), depending on risk tolerance.

Potential key reversal bottom detected for GLNDetected on 24-May (detailed commentary and full scan results available in the signature below), ASX:GLN represents a potential bullish opportunity with respect to a possible key reversal bottom formation detected, although the volume on the potential key reversal bottom signal day was rather mild. Trade suggestion would be to await for share price to test recent daily highs and observe indicator changes (i.e.: DMI/ADX and RSI) for signs of short-term bullish interest.
Stop loss for the trade (and indication that this trade is an absolute 'no-go') is any trade below the low of the signal day of 24th May (i.e.: any trade below $0.21).

Bullish potential detected for DEVDetected 10-May (detailed commentary and full scan results available in the signature below). Not activated as at time of review of 10-May, however did activate on 15th/16th May.
ASX:DEV represents a potential bullish opportunity should momentum continue and newer highs be made.
Entry conditions:
(i) higher share price above the day of the volume spike (10th May) along with swing up of indicators such as DMI/RSI.
Stop loss for the trade would be:
(i) below the support level from the low of 19th February (i.e.: below $0.345), or
(ii) below the support level from the low of 4th March (i.e.: below $0.33), depending on risk tolerance.

Potential key reversal bottom detected for BYEDetected in the latest scan for the week (detailed commentary and full scan results available in the signature below), ASX:BYE represents a potential bullish opportunity with respect to a possible key reversal bottom formation detected, although the volume on the potential key reversal bottom signal day was rather mild. Trade suggestion would be to await for share price to test recent daily highs and observe indicator changes (i.e.: DMI/ADX and RSI) for signs of short-term bullish interest.
Stop loss for the trade (and indication that this trade is an absolute 'no-go') is any trade below the low of the signal day of 14th May (i.e.: any trade below $0.042).

Bearish potential detected for EDVDetected 17-May (detailed commentary and full scan results available in the signature below). Not activated as at time of review of 17-May.
ASX:EDV represents a potential bearish opportunity should momentum continue and newer lows be made.
Entry conditions:
(i) lower share price along with swing up of bearish DMI indicator and swing down in RSI.
Stop loss for the trade would be:
(i) above the support/resistance level from the open of 1st May (i.e.: above $5.18), or
(i) above the support/resistance level from the open of 18th March (i.e.: above $5.22), depending on risk tolerance.

Bearish potential detected for CTTDetected 17-May (detailed commentary and full scan results available in the signature below). Not activated as at time of review of 17-May.
ASX:CTT represents a potential bearish opportunity should momentum continue and newer lows be made.
Entry conditions:
(i) lower share price along with swing up of bearish DMI indicator and swing down in RSI.
Stop loss for the trade would be:
(i) above the support/resistance level from the open of 2nd May (i.e.: above $2.94), or
(i) above the support/resistance level from the open of 17th April (i.e.: above $3.03), depending on risk tolerance.

Bullish potential detected for SLRDetected 30-Apr (detailed commentary and full scan results available in the signature below - will be covered in next commentary). Not activated as at time of review of 30-Apr.
ASX:SLR represents a potential bullish opportunity should momentum continue and newer highs be made.
Entry conditions:
(i) breach of the upper confines of the Darvas box formation - i.e.: above high of $1.49 of 19th April (most conservative entry), or
(ii) swing up of indicators such as DMI/RSI along with a test of prior level of $1.465 from 22nd April.
Stop loss for the trade (based upon the Darvas box formation) would be:
(i) below the support level from the low of 23rd April (i.e.: below $1.33).

Potential outside week and bullish potential for PSCDetected 17-May (detailed commentary and full scan results available in the signature below). Not activated as at time of review of 17-May.
ASX:PSC represents a potential bullish opportunity should momentum continue and newer highs be made. Trade is further supported by a volume spike noted on 17-May.
Entry conditions:
(i) higher share price above the level of the potential outside week noted on 17-May.
Stop loss for the trade would be:
(i) below the swing low of 15th May (i.e.: below $0.135), once trade activated.

Potential outside week and bullish potential for BC8Detected 10-May (detailed commentary and full scan results available in the signature below). Not activated as at time of review of 10-May.
ASX:BC8 represents a potential bullish opportunity should momentum continue and newer highs be made. Trade is further supported by a volume spike noted on 09-May.
Entry conditions:
(i) higher share price above the level of the potential outside week noted on 10-May.
Stop loss for the trade would be:
(i) below the swing low of 6th May (i.e.: below $0.255), once trade activated.

Bullish potential detected for AMC (gap continuation play)Detected 03-May (detailed commentary and full scan results available in the signature below). Not activated as at time of review of 03-May.
ASX:AMC represents a potential bullish opportunity should momentum continue and newer highs be made.
Entry conditions:
(i) higher share price above the day of gap-up (preferably along with swing up of indicators such as DMI/RSI) for a gap-continuation play.
Stop loss for the trade would be:
(i) below the support level from the low of the day of the gap-up on 2nd May (i.e.: below $14.97).

Potential outside week and bullish potential for CNBDetected 17-May (detailed commentary and full scan results available in the signature below). Not activated as at time of review of 17-May.
ASX:CNB represents a potential bullish opportunity should momentum continue and newer highs be made. Trade is further supported by a moderate volume spike noted on 17-May.
Entry conditions:
(i) higher share price above the level of the potential outside week noted on 17-May.
Stop loss for the trade would be:
(i) below the swing low of 13th May (i.e.: below $0.625), once trade activated.

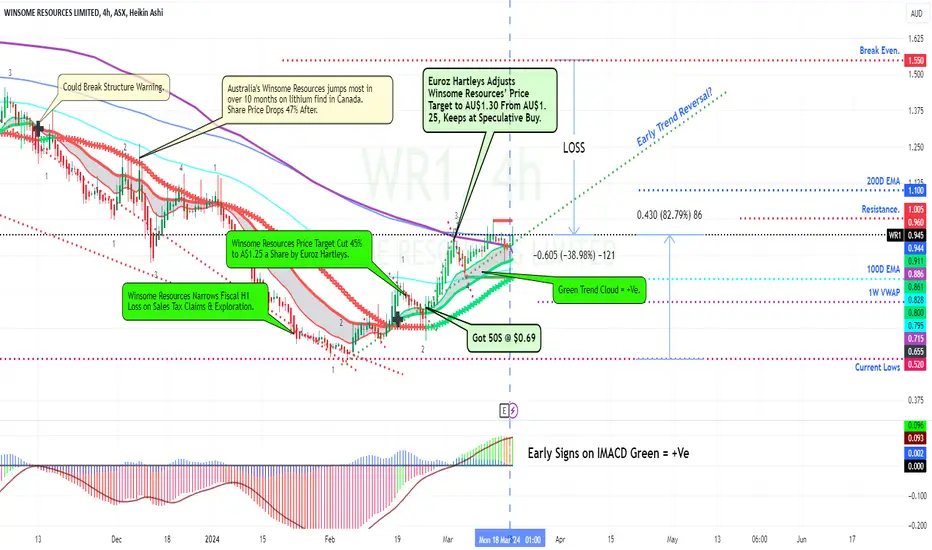
WR1.ASX Winsome Resources Trend Cloud Study.Winsome Resources has been Bashed Down with all the Lithium miners of the Last Year or more.
Just as High Inflation is the cure for High Inflation, I surmise the same could be true for these Miners - as they are forced to shut down certain operations, thereby decreasing supply.
They also become Targets for Takeovers and MA's.
As my Chart depicts, I also was caught by many Bull Traps, and I am in a Loss Scenario.
However, I am now seeing a potential reversal on the Trend Cloud and IMACD.
Adding to my position remains very Risky and is not a recommended policy
However if one got in near the recent lows & you are profitable - your Risk will be lower.
As my Chart depicts, I Diarise as much information as possible using the Call-Out Tool and Price Range % to assist with my decisions.
As always, please get a few outside Expert's Advice before taking Trade or Investment decisions.
Should you appreciate my Chart Studies, Smash That Rocket Boost Button. It's Just a Click away.
Regards Graham.
CYM (CYM.AX) BreakoutI see two breakout patterns. One the longer term, which starts from the original gap down to 35 to the low of 12 at the end of March. The stock then moved up to breakout at 35 on 29/04. The target for this formation is 35 - 12 = 23 pips from the low point to the breakout point, giving a target of 58.
The second is the shorter term, the smaller "cup" formation that starts at 42, down to the low of 32 on 14/05 back to the breakout point at 42 today. The target of this formation is 42 - 32 = 10 pips from the low point to the breakout point, giving a target of 52.
So two breakout patterns in play, giving short term targets of 52 and 58.
