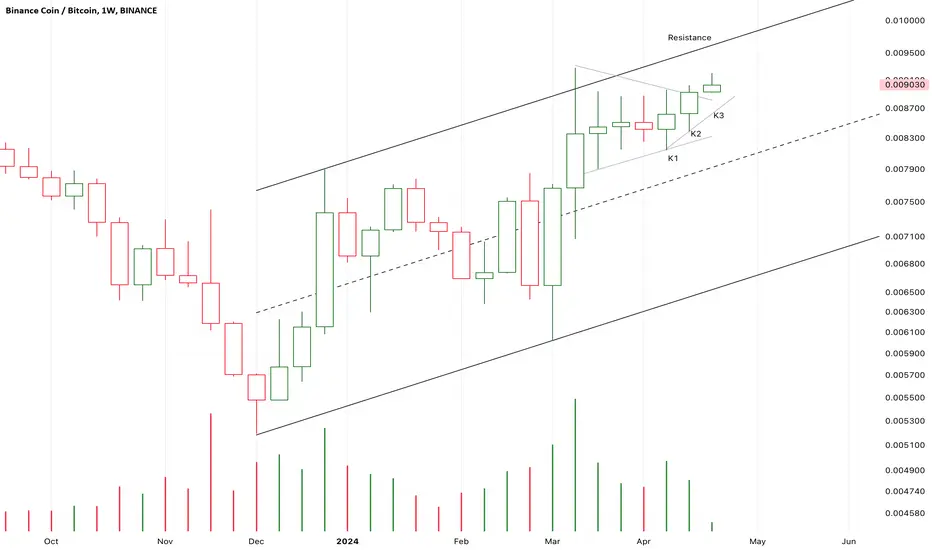
Chart Pattern Analysis Of BNB/BTC
It seems that BNB/BTC is trying to break up a bullish flag.
The possibility is relatively low here.
If K3 finally close upon the resistance,
Another bull run will start here.
If not, K3 will touch the resistance and fall back,
And the horizontal trend will go on.
Trading Signal for BNBBTC Pair**Direction**: BUY
**Enter Price**: 0.008791
**Take Profit**: 0.00887567
**Stop Loss**: 0.00867867
**Rationale:**
The recommendation to buy BNBBTC is based on an analysis performed using the EASY Quantum Ai strategy. Several factors have contributed to the decision:
**1. Technical Analysis:

This opportunity is too good to be missed !Technical context = the 4th opportunity of this kind that has occurred since 2017. Rare setup!!
The hype on Binance has been disgusting all summer with negative rumors, the aggressiveness of the SEC etc., which just reached its peak yesterday with the CEO of Binance sentenced to pay $4 billion and

BNBBTC.1WThe weekly chart for BNB/BTC offers a broad perspective on the market trends and technical levels significant for medium to long-term trading decisions.
Key Resistance and Support Levels:
Resistance 1 (R1): 0.012091 - This is a critical resistance level. A move above this could signal strong bullis

BNB/BTC - BNB: Trend Reversal◳◱ On the $BNB/ CRYPTOCAP:BTC chart, the Trend Reversal pattern suggests indications that the trend may be gaining or losing strength. Traders might observe resistance around 0.009008 | 0.009394 | 0.010214 and support near 0.008188 | 0.007754 | 0.006934. Entering trades at 0.008714 could be strateg

BNB/BTC - BNB: Super Trend◳◱ On the $BNB/ CRYPTOCAP:BTC chart, the Super Trend pattern suggests a pause in volatility, potentially gearing up for a breakout. Traders might observe resistance around 0.008778 | 0.009141 | 0.009767 and support near 0.008152 | 0.007889 | 0.007263. Entering trades at 0.008612 could be strategic,

BNB/BTC - BNB: Trend Reversal◳◱ On the $BNB/ CRYPTOCAP:BTC chart, the Trend Reversal pattern suggests indications that the trend may be gaining or losing strength. Traders might observe resistance around 0.008869 | 0.009226 | 0.009943 and support near 0.008152 | 0.007792 | 0.007075. Entering trades at 0.008422 could be strateg

BNB/BTC - BNB: BBand Breakout◳◱ On the $BNB/ CRYPTOCAP:BTC chart, the Bband Breakout pattern suggests a consolidation phase that could precede a trend continuation or reversal. Traders might observe resistance around 0.007471 | 0.008373 | 0.009799 and support near 0.006045 | 0.005521 | 0.004095. Entering trades at 0.006758 cou

Let's focus on BNBDear my friends,
With a pinbar on the weekly frame in November 2022. BNB's strength against BTC has been lost. The last week of 2023 I saw a reversal, with the BNB price breaking out of BTC's year-long dominance.
I have a pinbar retesting the resistance area. And I wait for another check. And that h

BNB/BTC - BNB: BBand Breakout◳◱ On the $BNB/ CRYPTOCAP:BTC chart, the Bband Breakout pattern suggests an upcoming trend shift. Traders might observe resistance around 0.007471 | 0.008373 | 0.009799 and support near 0.006045 | 0.005521 | 0.004095. Entering trades at 0.006764 could be strategic, aiming for the next resistance le

See all ideas