GOLDSILVER trade ideas

Why longer term charts are importantI took a look at the weekly gold/silver ratio and noticed a few significant patterns. For example, there was a notable acceleration downward following the break of a 3-year uptrend a couple of weeks ago. Additionally, there is support at the 74.65/63 level, which has been in place since January 2022.
This observation reminded me of the importance of examining long-term charts, regardless of your trading time frame. Longer-term charts provide essential context and clarity that short-term charts often lack.
Why everyone should be looking at longer term charts:
1. Identifying Trends
Long-term charts help in identifying significant trends that might not be visible in short-term data.
2. Smoothing Out Volatility
Short-term data is often noisy, with frequent fluctuations that can obscure the underlying pattern. Long-term charts smooth out this volatility, providing a clearer picture of the fundamental movement and reducing the influence of random, short-term events.
3. Contextualizing Current Movements
Long-term charts place current price or economic movements in a broader context. This helps investors and analysts understand whether a recent change is part of a larger trend or not.
4. Historical Comparisons
These charts allow for comparisons with past periods, making it possible to identify cycles, recurring patterns, and historical precedents. This historical perspective can be invaluable for forecasting future movements and making informed predictions.
5. Assessing Risk and Reward
By examining long-term performance, investors can better assess the potential risks and rewards of an investment. Understanding how an asset has performed over various market cycles helps in evaluating its stability and growth potential.
6. Avoiding Emotional Bias
Short-term market movements can evoke strong emotional responses, leading to impulsive decisions. Long-term charts provide a more detached view, helping investors stay focused on long-term objectives and avoid reacting to short-term market noise.
Conclusion
In summary, long-term charts offer a comprehensive view that is critical for understanding trends, reducing noise, contextualizing current events, making historical comparisons, assessing risk, avoiding emotional decisions, developing strategies, and analysing economic cycles. They are an indispensable tool for anyone involved in financial markets or economic analysis, providing the clarity and perspective necessary for informed decision-making.
Disclaimer:
The information posted on Trading View is for informative purposes and is not intended to constitute advice in any form, including but not limited to investment, accounting, tax, legal or regulatory advice. The information therefore has no regard to the specific investment objectives, financial situation or particular needs of any specific recipient. Opinions expressed are our current opinions as of the date appearing on Trading View only. All illustrations, forecasts or hypothetical data are for illustrative purposes only. The Society of Technical Analysts Ltd does not make representation that the information provided is appropriate for use in all jurisdictions or by all Investors or other potential Investors. Parties are therefore responsible for compliance with applicable local laws and regulations. The Society of Technical Analysts will not be held liable for any loss or damage resulting directly or indirectly from the use of any information on this site.


Gold SIlver ration 51724Huge event as GSR finally capitulates. It has broken down and targeting the floor of 30 oz silver to 1 oz gold.
Ive told ppl I was accumulating all major crashes in silver since it dumped into the teens in the RONA crash. I was laughed at. But just like Bitcoin it was a game of patience.
Long term will we see Silver return to its historical average of around 10 to 1? No one knows but imo Silver has been manipulated so low for so long. That now it could blow and completely destroy all shorts and rip to levels. THat you would likely scoff and laugh at.
The silver stackers will have the last laugh


The Fateful Golden Candles of 22 and 23Hey everyone!
In the previous idea that I made on December 30 last year. I stated that a gold candlestick in the green zone determines the goldsilver price trend in 2022 and based on that I expected a zigzag and bullish price in 2022 for goldsilver.
But what to expect in 2023?
The trend of the candles indicates the fall of this index toward Fibo 78.6 and Fibo 100 .the detail is shown in the this Idea.
2023 is generally a very good year for the stock market and gold.


Gold/Silver Ratio will Break the 375-day Triangle Pattern SoonGold/Silver Ratio will break the 375-day Triangle Pattern soon. There was a false breakout to the upside last week. Price couldn't break the trend line. Gold/Silver Ratio is expected to go down.
Formed Patterns : Shooting Star Candlestick Pattern, Rising Wedge Pattern, Double Top Pattern on the momentum indicator.
Scenario 1 : Gold/Silver Ratio quickly goes to 76 levels.
Scenario 2 : Gold/Silver Ratio hits 81.58 and retreat to the 86. And then goes to 76.

G/S Ratio Breaks Out. Bearish for Gold & SilverThe Gold-Silver ratio, which represents the number of ounces of silver required to purchase one ounce of gold, is currently showing a bearish trend. This is evident from the ratio breaking its 19-day chart, indicating a significant shift towards bearishness for precious metals. This trend suggests that the market may experience many months of downside, which could lead to a considerable decline in the prices of gold and silver. Investors may want to exercise caution and consider diversifying their portfolios in light of this trend.
I am shorting silver.


GOLDSILVER RATIO, Moving In Downtrend-Channel, More To Come! Hello, Traders Investors And Community, welcome to this analysis about the gold-silver ratio, its current price-action, and what we can expect the next time. In my observation, I found some significantly sings in the chart which will affect the ratio fundamentally farther the next days and weeks. The goldsilver ratio is an important ratio to track the number of silver ounces compared to one ounce gold, therefore, it is providing important information about the value between silver and gold. I made already the analysis of gold and silver, if you didn't saw these already I recommend to you that you go to my account and have looked to have a full-depth-overview of the analysis in the gold-silver ratio and its interrelation to gold and silver.
When looking at my chart you can see that the ratio is trading in a huge and fundamental downtrend-channel which you see marked in blue. We already touched the channel lower and upper boundary several times to form the overall downtrend-related channel. At the moment the ratio fell down from an important support-point at the 109 level, you can see this big red candle to the downside with high volatility it is suggesting that the ratio is turning to the downside here and that we will continue in the downtrend-channel until important support has reached.
The next time we can expect a bounce back to the 109 support/resistance level where the likelihood increases that the downtrend continues when the huge heavy bearish-confluence-cluster zone you can see in my chart is confirmed. We have several resistances there which building the logical resistance-level, first it is the 50-EMA which you see marked in blue, second, it is the 109 support/resistance level and third, it is the upper boundary of the falling downtrend-channel, therefore, I don't expect a breakout of the channel here so far and the rise to the downside will continue.
In this situation it has to keep in mind that the worth fullness of silver compared to gold rises, this is insightful because at the moment we see more volatility to the upside and sharp rises in silver than in gold, it also means that the value of silver can increase higher and gold gets cheaper compared to silver which is an indication for the bullishness I mentioned already in the silver-analysis. Investors and traders can take advantage of it when the ratio drops more to buy silver instead of gold or to exchange the gold for silver for a later exchange back when the ratio increases again. This should be a good opportunity to make a profit out of the situation with gold and silver.
Alright, this should give you a good overview, thanks to everybody for watching, support for more market insight, and all the best!
The ambition to transform opportunity into gold remains the most significant tool for a trader.
In this manner: FAREWELL
Information provided is only educational and should not be used to take action in the markets.


Gold / Silver Ratio vs DXYThe Gold/ Silver ratio is now highly correlated to the US Dollar Index . Why ? Simple . Because a "Real" precious metals bull market is always characterized by two main things ... 1. A falling US Dollar and 2. Silver outperforming Gold .
Here we have both these indexes confirming each other and turning to the downside from my perspective .
GOLDSILVER in white/black and DXY in orange/red

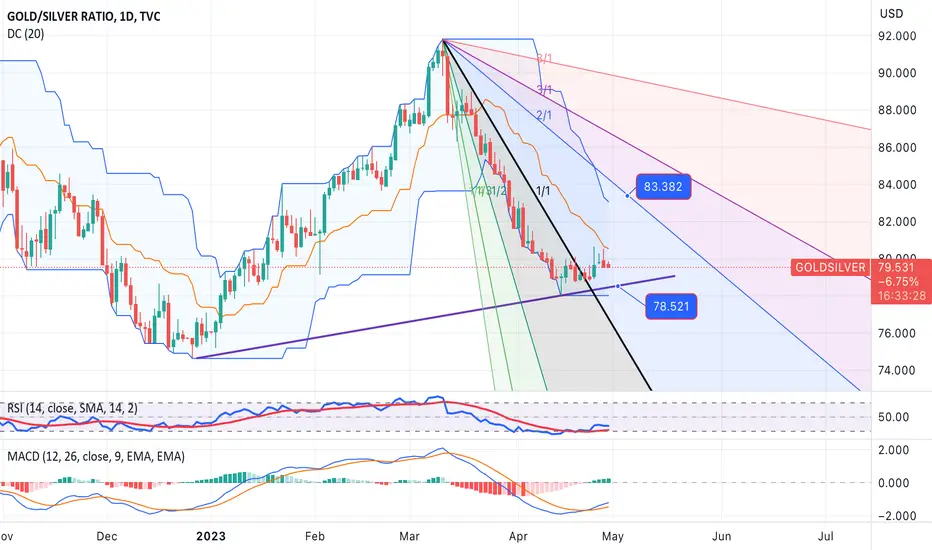
GOLDSILVER ratio- BUY strategyThe GOLDSILVER ratio is low, and MACD being positive right now, and a low RSI suggest this being a reasonable trade to look at.
The strategy is to BUY GOLD vs. SILVER in of course measured equal USD values and take profit for the ratio @ 82.75 for now. Place stop-loss below 78.25 for now.


Gold / Silver and what it means for SilverSilver is losing to gold as it has been for months, but we're getting close to the gold/silver ratio of 98-100 area. At that point this chart should reverse which likely means - Gold starts getting a bid and Silver starts to outperform Gold. So yeah this ongoing dip might be the one to buy for long term, but keep in mind this can go on for a few more months.


GOLDSILVER - Keep an eye on GOLD:SILVER ratio and place your betGOLDSILVER seems to have fallen into approximate Bollinger Band behaviour over the past months.
One cannot say it has exactly as there are always exceptions.
However, a triple crossover of the upper band is a fairly strong indicator that a down tick is imminent.
So either gold will fall or silver will rise. It is for you to decide and place your bets...
As always cross-check with other indicators.
Good Luck
Goldybug

