SPY: How much Higher will it go? In this video I attempt to address the question I think everyone is wondering, "how much higher will this go?".
In addition, I briefly talk about next week's levels and probability.
Safe trades everyone!
SPY trade ideas

S&P Tug of War Continues as Market Seeks ClarityLast week marked some of the most unclear price action we've seen. Starting on Tuesday, sellers gradually took control from buyers, but most of the action occurred during extended hours (meaning on VERY low volume). On Friday, sellers finally acted during regular trading hours and attacked the market right from the open. However, it seems buyers were only waiting for this, as the price suddenly pivoted, and the day ended with a spectacular bull run.
At this moment, the market is sending very confusing signals, and the best strategy for a swing trader is to simply stay away for some time. Here's a formal summary of the current situation:
1. Long-term Bullish . The price is in an uptrend on both weekly and monthly timeframes. May closed above April’s high
2. Short-term Bearish . Weekly consolidation is in progress, and despite the bull show-off on Friday, the market is still consolidating on the weekly timeframe. Moreover, the week closed with a bearish "hanging man" candle.
3. Respect Friday’s Bull Run . It was unusually strong for bearish context and could easily develop into something significant.
To develop a convincing thesis, we need to see some clarity on the daily chart. Either bears will confirm a daily lower high, signaling the continuation of the weekly consolidation, or bulls will set a daily higher low, signaling the continuation of the uptrend. Until this happens, we can expect more unexpected moves in both directions without much follow-through.
Disclaimer
I don't give trading or investing advice, just sharing my thoughts.


SPY short hunt is ontoday is still early and will say next week for real signal but will put on a few puts today

SPY FORECAST PRICE AND TIME I did this by my eye.. so not saying this 100% going on but in its area...ive put a lot a work to this. LUNAR CYCLE>>> with other cycles with wycoff and cosnidering where price is at in this cycle all of this is recent information i have posted pior to this... check out my yt for audio and my pov.... Trader Cw1ss... here to help and conquner our worries... Fear is a make belive emtion that the devil makes you belive... remmber who "i am" and the powers that come wit it... theres nothing new under the sun.. hint into what i belive the lord is the sun.. the lord must rise and fall... then theres a light that rules the day and night... for more info trader cw1ss on yt

SPY evening star setupFor those of you who understand candlestick patterns, this is not news to you.
The weekly SPY is setting up an evening star formation. It's a bearish setup on a weekly chart. More importantly, it should be noted as a false breakout (if we close near current levels)


Let see if SPY bulish tomorrow June 3 (?). Disclaimer: This is for study purposes only and does not constitute financial advice. You are responsible for your own trading risks.
Observations :
Volume Profile:
Point of Control (POC): Near $522.
Value Area High (VAH): Around $528.15.
Value Area Low (VAL): Approximately $518.36.
Trend Analysis:
There was a significant downtrend followed by a strong upward breakout from a falling wedge pattern, indicating a potential reversal.
Support and Resistance Levels:
Immediate Support: Near the POC around $522.
Immediate Resistance: Near the VAH at $528.15.
Further Resistance: Around $530.50.
Moving Average Convergence Divergence (MACD):
The MACD lines are below the histogram, showing a recent bullish crossover, which typically suggests upward momentum.
Trading Suggestion for Tomorrow:
Given the strong breakout from the falling wedge and the bullish momentum:
Bias : Bullish
Bullish Scenario:
Entry Point : Look for entries around $525, if it pulls back towards the support level or continues the upward momentum.
Target Levels:
Short-term Target: $528.15 (VAH).
Next Target : $530.50.
Stop Loss: Place a stop loss below $522 (POC), to limit downside risk if the breakout fails.
Bearish Scenario:
Entry Point: If there is a rejection at $528.15, consider short positions.
Target Levels:
Short-term Target: $522 (POC).
Next Target: $518.36 (VAL).
Stop Loss: Place a stop loss above $530.50, to manage risk if the resistance breaks.
Conclusion :
The chart shows a bullish breakout with significant volume, indicating a strong potential for upward movement. Trading in the direction of this breakout while monitoring key levels (support at $522 and resistance at $528.15 and $530.50) can be a prudent approach. Adjust stops and targets based on intraday price action and market sentiment.

$SPY Triple Top...AMEX:SPY getting spicy here, looks like a triple top for now headed into a lot of world news, ie Iran/Israel/Biden ... I think we've been overdue for a correction, this is a VERY solid base to start a downtrend and fill some gaps before heading back up for Trump Presidency... Buy the rumor stuff...
No positions, will look for continuation tomorrow...
- Prof
watch datestrtucutire isnt right for this timeframe but oiverall strucutre will happen. just now extenedend as i made it on the chart..
june first sell
2-3 days buy and go long
june 6th-7th sell and add more postions on june 14-15th

SPY Under Pressure! SELL!
My dear subscribers,
EUR/USD looks like it will make a good move, and here are the details:
The market is trading on 529.51 pivot level.
Bias - Bearish
My Stop Loss -536.17
Technical Indicators: Both Super Trend & Pivot HL indicate a highly probable Bearish continuation.
Target - 519.29
About Used Indicators:
The average true range ATR plays an important role in 'Supertrend' as the indicator uses ATR to calculate its value. The ATR indicator signals the degree of price volatility.
———————————
WISH YOU ALL LUCK

The market is taking a breakLooks like the market is going to make another visit to the uptrend line from October 2023. Be ready for a bumpy ride in the next couple of weeks. Save some cash for the right moment to buy or short something. We are still on a bull market.

S&P500 ETF Trust (SPY) Fell 0.55% Today is the Bullish Run Over?Economic indicators are crucial for policymakers, advisors, investors, and businesses to make informed decisions regarding business strategies and financial markets. In the week ending May 23, the SPDR S&P 500 ETF Trust (SPY) fell 0.52%, while the Invesco S&P 500 Equal Weight ETF (RSP) was down 1.75%. This article examines three indicators from last week — existing home sales, new home sales, and consumer sentiment. These data points provide an update on the current state of the housing market and consumer attitudes about the current and future strength of the economy.
Existing home sales fell for a second straight month in April as elevated mortgage rates and increased home prices continue to weaken demand. The median price for an existing home sold last month was $407,600, an all-time high for the month of April, marking the 10th consecutive month of year-over-year increases for existing homes. New home sales fell 4.7% in April to a seasonally adjusted annual rate of 634,000 units, falling short of the expected 677,000 units. April’s sales are 7.7% below what they were a year ago, marking the first annual decline in over a year.
Consumer sentiment fell to its lowest level in six months, according to this month’s final report for the Michigan Consumer Sentiment Index. The Michigan Consumer Sentiment Index is a monthly survey measuring consumers’ opinions with regard to the economy, personal finances, business conditions, and buying conditions. A closer look at May’s report revealed that consumers are concerned over the labor market, high interest rates, income growth, and inflation.
The outlook for the stock market's most important driver just keeps getting better. S&P 500 earnings grew 6% in the first quarter from a year ago, according to data from FactSet. When excluding dismal earnings from Bristol Myers-Squibb (BMY), the results were even better, with earnings growing 10%, per Bank of America. Consensus now sees earnings growing 11.4% in 2024, up from a projection of 10.9% on April 5. In 2025, earnings growth estimates have moved up to 14.2% in 2025 from the 11.6% growth seen that day.
On Tuesday, UBS Investment Bank US equity strategist Jonathan Golub boosted his year-end S&P 500 target to 5,600 from 5,400, citing "stronger earnings." This trend is supported by further market upside, as economic "tail risks" have declined, with consensus estimates for economic growth increasing throughout the year. Deutsche Bank's chief global strategist Binky Chadha recently told Yahoo Finance that further growth than expected in the economy could help the S&P 500 reach 6,000 by the end of the year.
Technically, the S&P500 ETF Trust index price charts depicts the ending of the 5th wave Bullish Divergence pattern which resonates with Elliot Waves theory. The Relative Strength Index which sits at 58.60 signifies weaker growth from the consumer Index.

The Mechanics Of Trading - Part IIIPart III
I started this video because a friend asked me for help determining trends on multi-interval (time frames) and asked how I look at trading across multiple intervals. Asking how to best setup/use price trends to capture the best trade setups.
Essentially, it comes down to three key components...
A. Initial reversal/impulse waves should be traded lightly (if at all). They are the "potential price reversal setups" that are usually the most dangerous for traders (and often fairly short in length).
B. Looking for the second wave to form provides traders with the opportunity to catch the bigger Wave-3. This wave forms after the impulse (Wave-1) and a corrective wave (Wave-2), which must stay below any previous ultimate high or above any previous ultimate low.
C. Wave-3, and Wave-5 if applicable, are where traders can flex their muscles related to trade size using the techniques I present to try to capture the MEAT (Sweet Spot) of any trend.
Remember, after Wave-3, you must prepare for the potential end of a trend setup where volatility is likely to increase and risks become a bit more elevated.
I go over multiple techniques in this video.
Fibonacci techniques and Fibonacci Price Theory
Anchor Bars (breakaway bars)
Using Fibonacci Retracements to identify key support/resistance levels for trending
Stochastics
RSI
Wave formations (ZigZag)
and Others
This video is designed as an instructional video to help you incorporate usable techniques into your own trading style.
Hope you enjoy.

The Mechanics Of Trading - Part IIPart I
I started this video because a friend asked me for help determining trends on multi-interval (time frames) and asked how I look at trading across multiple intervals. Asking how to best setup/use price trends to capture the best trade setups.
Essentially, it comes down to three key components...
A. Initial reversal/impulse waves should be traded lightly (if at all). They are the "potential price reversal setups" that are usually the most dangerous for traders (and often fairly short in length).
B. Looking for the second wave to form provides traders with the opportunity to catch the bigger Wave-3. This wave forms after the impulse (Wave-1) and a corrective wave (Wave-2), which must stay below any previous ultimate high or above any previous ultimate low.
C. Wave-3, and Wave-5 if applicable, are where traders can flex their muscles related to trade size using the techniques I present to try to capture the MEAT (Sweet Spot) of any trend.
Remember, after Wave-3, you must prepare for the potential end of a trend setup where volatility is likely to increase and risks become a bit more elevated.
I go over multiple techniques in this video.
Fibonacci techniques and Fibonacci Price Theory
Anchor Bars (breakaway bars)
Using Fibonacci Retracements to identify key support/resistance levels for trending
Stochastics
RSI
Wave formations (ZigZag)
and Others
This video is designed as an instructional video to help you incorporate usable techniques into your own trading style.
Hope you enjoy.

SPY bigger pictureI am going slowly short.
SPY should make another leg down this week.
Level of interest is 475-470
Lets see what Wednesday will bring, until then we should stay flat.
From the lows of 470, we shall do the usual election run.
target 548?
Ill be updating this idea.

$SPY Powerful OUTSIDE Bar Swing TradeFREE #OPTIONS Ideas
Scale out when above 25% Profit
AMEX:SPY 527C>526.59 | 519P<519.27
NASDAQ:INTC 31C>30.86 | 30P<30.04
NASDAQ:AAPL 195C>192.30 | 190P<190.18
NASDAQ:AMD 170C>168.56 | 160P<161.01
LIKE IF YOU WANT MY FREE PICKS DAILY!

$SPY May 31, 2024AMEX:SPY May 31, 2024
60 Minutes.
As expected, 522 was achieved.
21 ema of daily done.
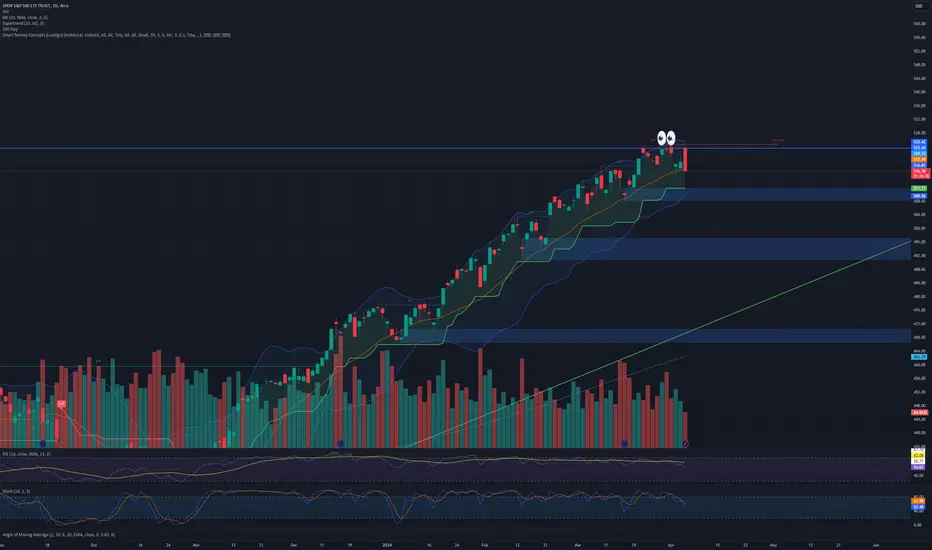
In Both daily and 60 minutes the bar making ATH is the issue. It had close near low of bar.
Hence long for higher target is only above 533.5 levels with close near top of bar.
Yesterday i had shared A, B And C.
And said B and C was important for the day.
Today i will consider A the rise from 499.55 to 533.
We can see in daily the rise was swift.
Thats being corrected now.
I expect AMEX:SPY to consolidate around 516 - 517 levels before next uptrend as long as 488-492 is held on any retrace.
Now for the day in 15 minutes we have oscillator divergence.
AMEX:SPY making LL but not supported by Oscillator.
Considering the fall 529.9 to 521.34 a retrace to 526.5 is possible being 61.8% retracement and 10 averages too.
So today contra trade could be a buy around 522 - 522.5 levels for 525 - 526 as target or sell 525-526 for 518-519 levels.
S&P stalls in indecision; still bullishLast week was marked with indecision. Market was moving in a narrow range while Buyers were waiting for FOMC ad NVDIA’s earnings. After receiving positive confirmation (FOMC neutral, earnings good) market tried to go higher but found no support from large players. Sellers took advantage of the weakness and dropped price, clearing many weak longs established in the previous 5 days. It was a strong move but for some reason sellers lacked conviction to go lower. Price pivoted after filling the gap from Wednesday 15th and went back into the balance zone ( 527.5-531.5 ).
We should expect more pushes and pulls in the short term while market is fishing for new information. To confirm their control buyers must clear last week high ( 533 ) and build value above it. Bears’ objective is to break last week low ( 525 ). Until it happens the most likely scenario is bracketing within last week range.
It is important to note that while short term direction is unclear, we are still in weekly uptrend. So bears must work twice hard to prove their strength
Disclaimer
I don't give trading or investing advice, just sharing my thoughts.

SPY levels - Time to be patient Let's quickly review some levels in SPY.
I can see potential support at 525 as a base flip level.
523 also looks like support - here are 21 EMA + the flag bottom + gap fill.
The obvious resistance here is 532-533.
One key thing I want to mention: the market is now ranging, and it's important to be patient and give it some time to form clearer price action and confirm the next momentum.

SPY Summer PullbackThe recent low levels of liquidity may become more prevalent moving into the summer time as vacation time for many nears.
I am also waiting to hear the decision from the Bank Of Canada as well as other major banks around the world about the start of quantitative easing and lowering interest rates as soon as June.
The only problem with this, is the increasing value of the USD/DXY which may begin to strengthen against other currencies whom begin their devaluation.
Because the markets are generally measured relative to the dollar, a stronger DXY may provide the market with some downside in the summer months.
We do have some gaps (inefficiency) below at approx. 505-510 on the SPY. Interestingly or not , the golden 0.618 golden fib overlaps perfectly in these potential support zones.
I do not quite see the larger probability of a major market crash during an election year at the moment, and the longer term trend is still bullish.
Lets see how things play out

ICT Short setup SPY swing trade, retracement trade👋Hello Traders,
Our 🖥️ AI system detected that there is an H4 or higher timeframe ICT Short setup in SPY for Swing trade.
Of course SPY is in up trend in Daily chart, so this is a retracement trade for reference.
Or you could consider to buy SPY after reaching the demand zone marked on chart.
Please refer to the details Stop loss, FVG(Sell Zone),open for take profit.
For more ideas, you are welcome to visit our profile in tradingview.
Have a good day!
Please give this post a like if you like this kind of simple idea, your feedback will bring our signal to next better level, thanks for support!

$SPY May 30,2024AMEX:SPY May 30,2024
15 Minutes.
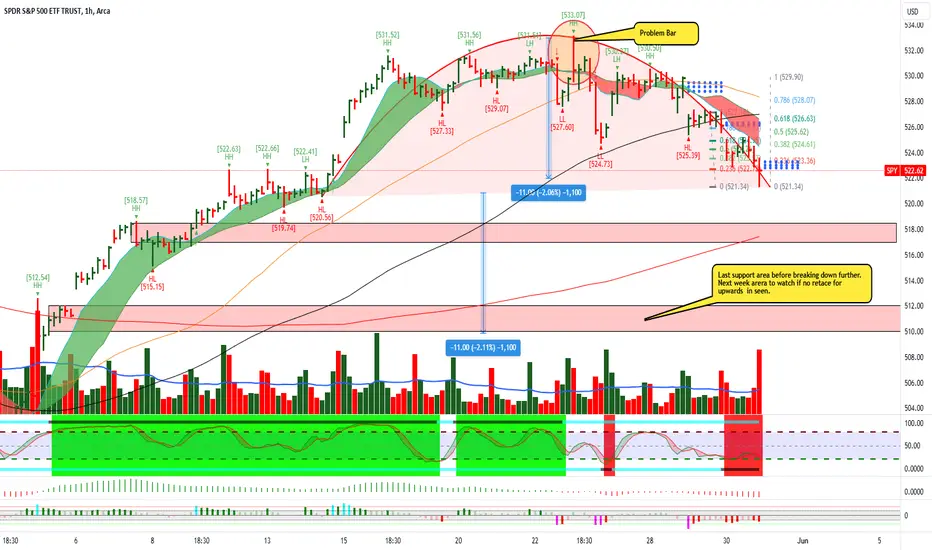
At the moment long only above 533.07 for any higher targets.
A The rise from 493 to 533
B The rise from 519.74 to 533.07
C the fall from 529.9 to 525.39
AT the moment these are the 3 important numbers.
At the moment I will consider B and C only.
For the rise B important to hold 524 levels being 61.8% retracement for the rise.
For the fall 529.9 to 525.39, a retracement to 528 levels will give an opportunity to short.
At the moment upside is limited to 532 533 levels
Since we have multiple touch points on 531-533 levels, I expect a swift move upside once 533.5 is crossed convincingly.
And on downside 524 is important to hold. If 524 is broken, then we can see at least 521-522 as target which is 21 ema in daily.
So, I will think only on short side today.
